


Time, Cost, and Workflow Efficiency Statistics · Evidence chart
Content Repurposing Statistics 2026: 42 Data Points on Adoption, Efficiency, and AI
6 original sources
TapVid research library
Source-audited video research with samples, denominators, and limitations kept beside every finding.
This collection is editorial synthesis of third-party and first-party published research. It is not a TapVid-owned survey.
Time, Cost, and Workflow Efficiency Statistics · Evidence chart
6 original sources
Reported ROI by Video Format and Channel · Evidence chart
7 original sources
What Exact Explainer Video Conversion Rate Benchmarks Show · Evidence chart
10 original sources
Platform Engagement Benchmarks Are Not Interchangeable · Evidence chart
7 original sources
Small business owners who had repurposed content
70%
Self-reported result; not an audited time or cost saving.
Open original sourceSmall business owners who named time savings as the main benefit
54%
Self-reported result; not an audited time or cost saving.
Open original sourceMarketers who said they repurpose content
94%
Small sample and undisclosed geography.
Open original sourceRespondents who chose repurposing as most cost-effective
65%
Self-reported result; not an audited time or cost saving.
Open original sourceShort-form video named among formats with the biggest ROI
48.6%
More than 1,500 global marketers; self-reported format ranking
Open original sourceLong-form video named among formats with the biggest ROI
28.6%
Same global marketer survey; format subgroup n not public
Open original sourceLive-streaming video named among formats with the biggest ROI
25.1%
Same global marketer survey; no controlled format comparison
Open original sourceB2B marketers ranking YouTube among their top three social platforms for ROI
40.5%
Global B2B subgroup; subgroup n and country mix not disclosed
Open original sourceTwentyThree videos under two minutes
≈80%
More than 2 million videos overall; duration-bucket play count undisclosed
Open original sourceTwentyThree videos from two to five minutes
≈55%
Rounded platform estimate; content mix and bucket count undisclosed
Open original sourceTwentyThree videos from five to 15 minutes
≈50%
Intent and format mix uncontrolled
Open original sourceTwentyThree videos from 15 to 45 minutes
≈45%
Long-form audience intent may differ from a typical program
Open original source
Time, Cost, and Workflow Efficiency Statistics · Evidence chart
42 content repurposing statistics on actual use, time, formats, AI, and results, with direct sources, sample boundaries, and research caveats.

Reported ROI by Video Format and Channel · Evidence chart
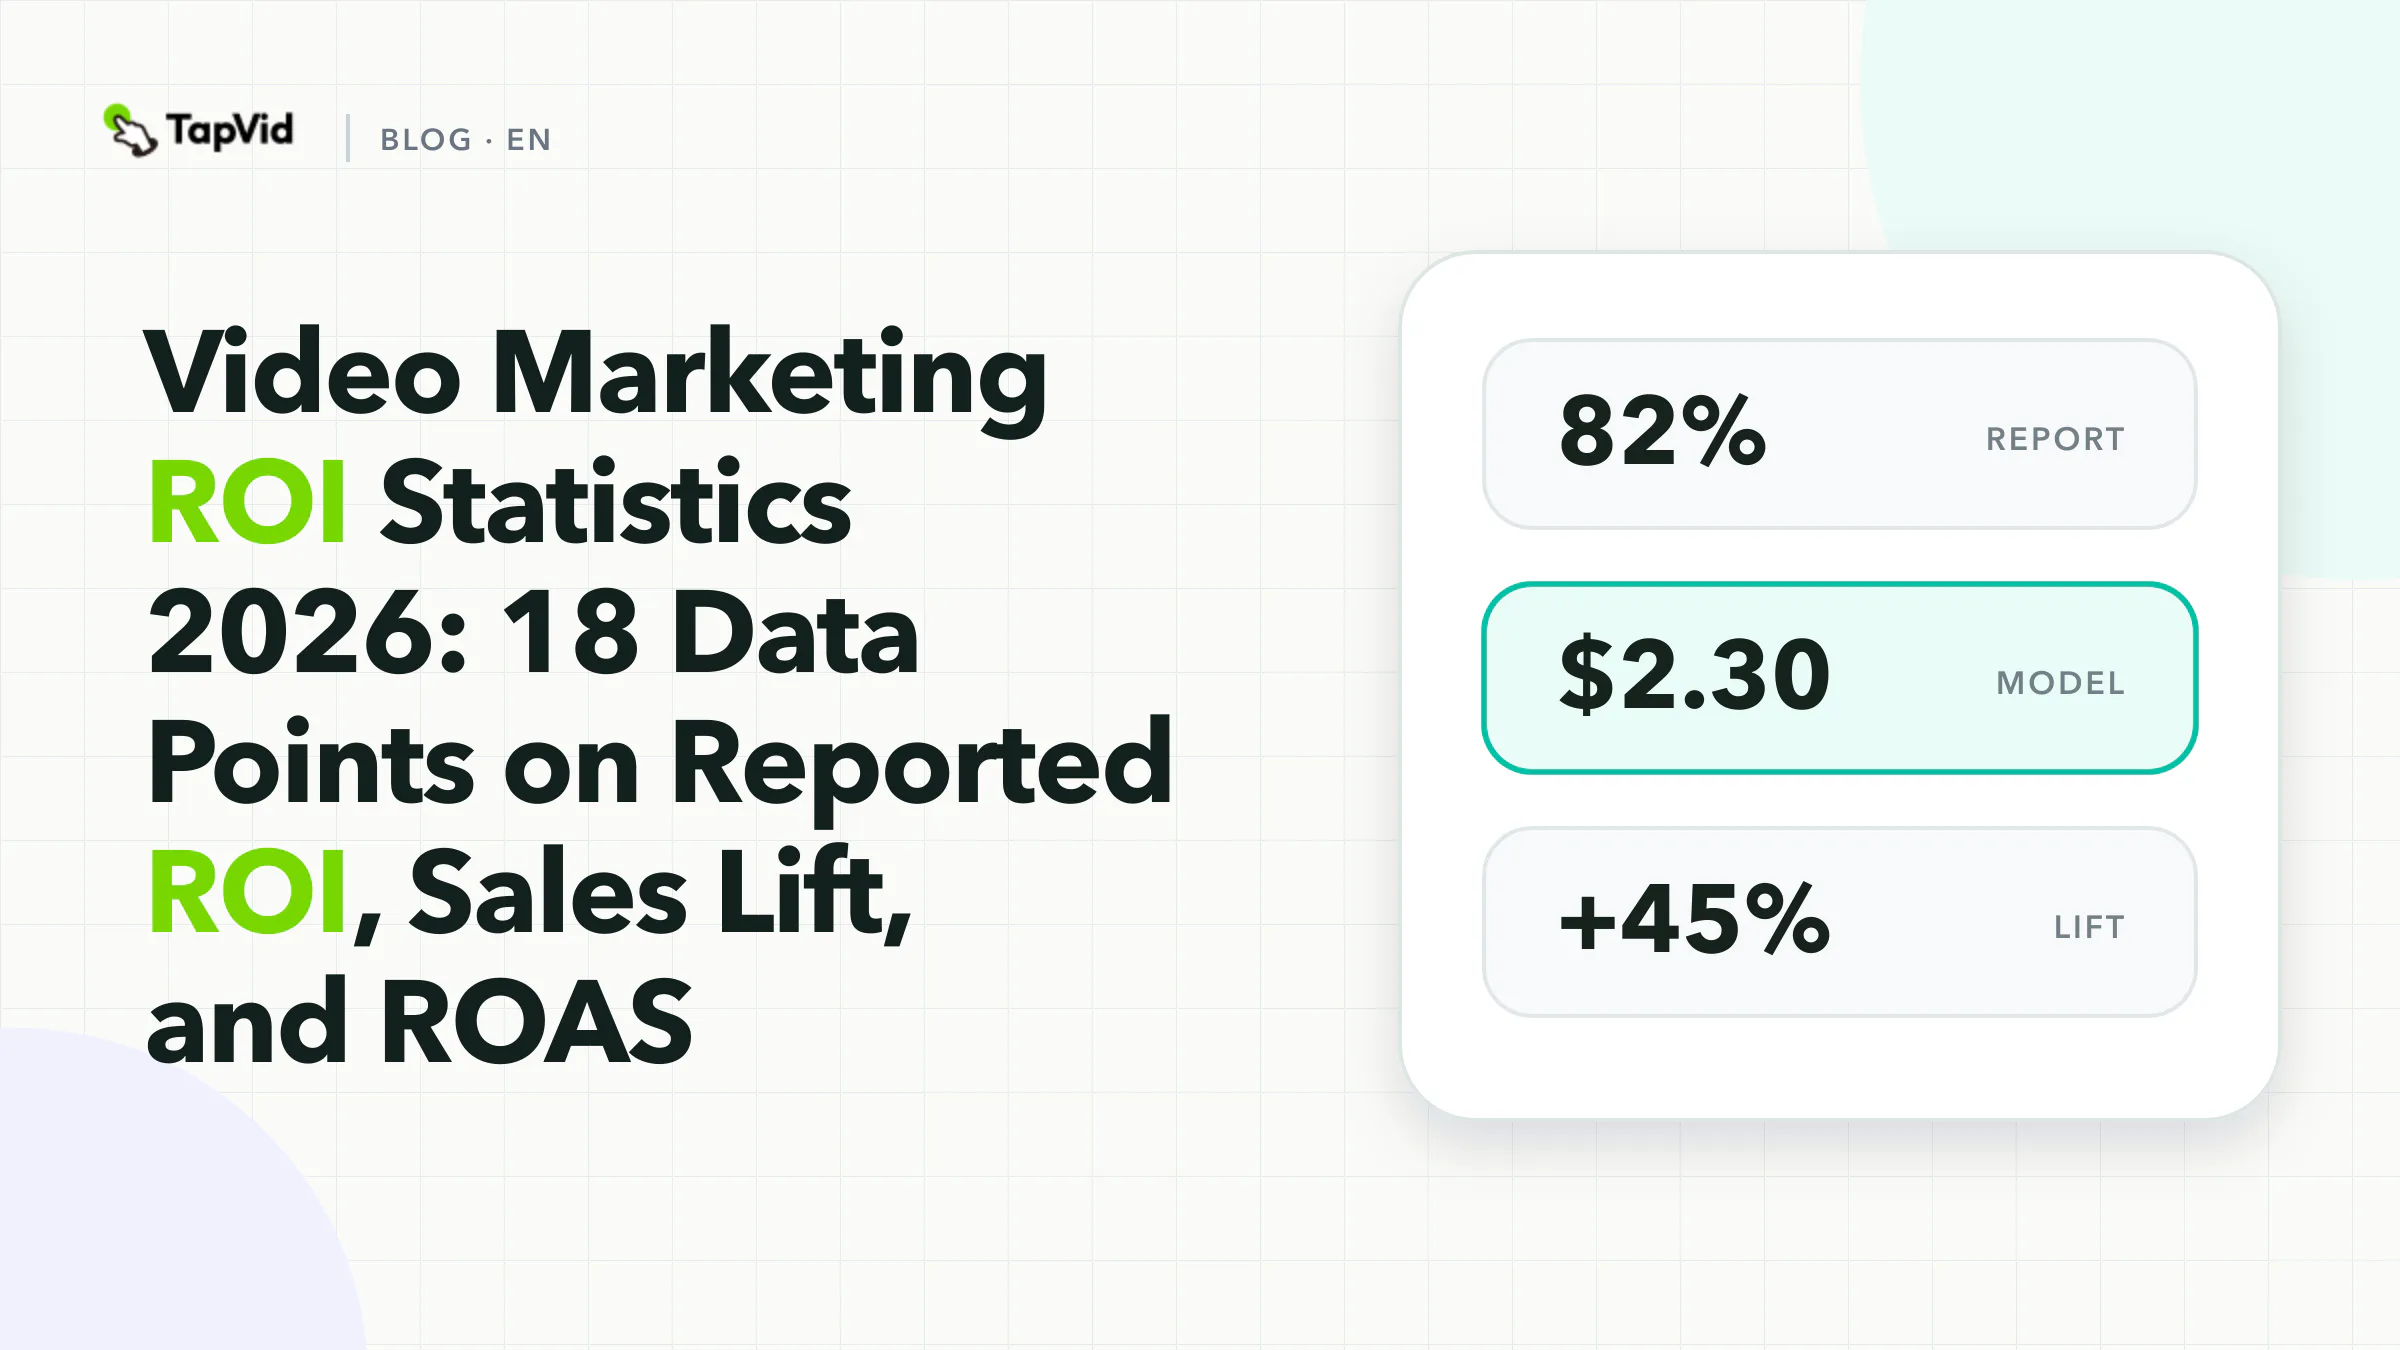
18 video marketing ROI statistics on reported returns, direct sales, investment signals, modeled sales lift, and ROAS, with source limits.

What Exact Explainer Video Conversion Rate Benchmarks Show · Evidence chart
A 2026 audit of 27 explainer and adjacent conversion data points, including causal lift, negative tests, null results, and purchase intent.

Platform Engagement Benchmarks Are Not Interchangeable · Evidence chart
32 video marketing analytics data points on metrics, attribution, engagement, CTA and form benchmarks, with denominators and evidence limits.
We prefer original research, preserve population and sample boundaries, separate reported perception from measured behavior, and correct or withdraw a finding when its source can no longer support it.
TapVid Explainer Video Engine
TapVid keeps your supplied assets and wording visible, lets you review script-to-scene correspondence, and produces the video in minutes.
Explore the explainer video engine