TapVid
    API & MCPPricingBlogAbout

    Infographic Video Maker

    Turn a report, a set of stats, or a prompt into an animated infographic video. TapVid generates the charts, icons, and motion from your content. No templates, no designer.

    Create better videos with the TapVid community

    Tutorials

    Step-by-step workflows

    Good cases

    See what works

    Support

    Get answers

    Join Discord→

    What is an infographic video maker?

    An infographic video maker turns information into a short animated video instead of a static image. You give it your stats, a report, or a prompt, and it produces a video where the numbers count up, the charts build, and the key points arrive one at a time. TapVid generates this from your content, so the infographic is about your data, not a template someone else already used.

    A still infographic asks the reader to take it all in at once. An infographic video controls the order and the timing, so one figure lands before the next, and the point you care about gets the emphasis. Traditionally that meant a designer animating each element in After Effects, or hours in a drag-and-drop editor placing every icon by hand. TapVid reads your content and builds the scenes for you.

    Because the video is generated, you shape it by prompt. Ask for a different chart, a slower reveal, or a version that opens on the headline stat, then regenerate until it reads clearly. When it looks right, export it for a report, a social post, or a presentation.
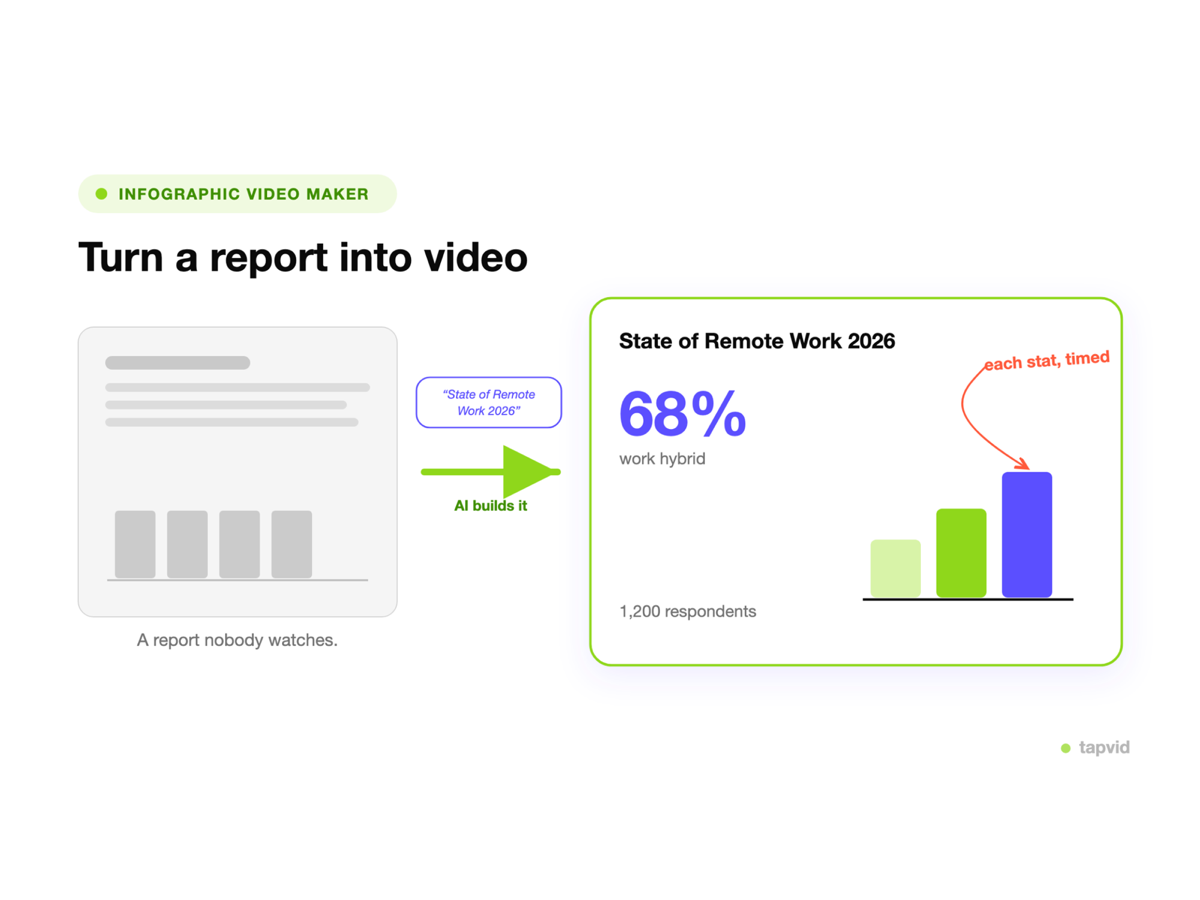
    From a report to an animated infographic

    A report turned into an animated infographic with counting stats and a bar chart

    Paste your data or content

    Drop in your stats, a report, a link, or a prompt. TapVid reads what matters and decides what to animate.

    • Stats, report, link, or prompt
    • No spreadsheet importer needed
    Three steps: paste data, AI builds the scenes, refine and export

    From a report to a video, in three steps

    Paste the data, TapVid builds the counting numbers and charts, then you refine by prompt and export.
    • Counting numbers and charts
    • No timeline, no drag-and-drop
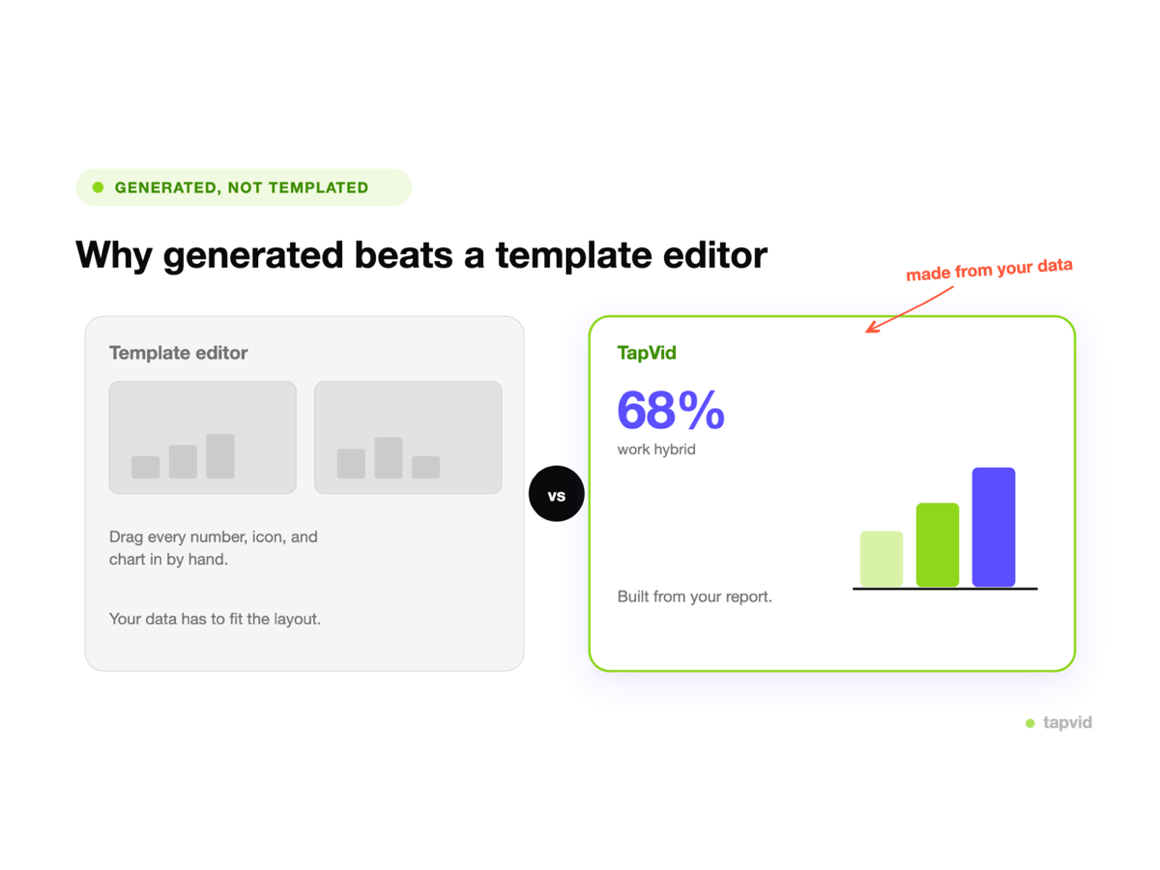
    Template editor versus a TapVid-generated infographic

    Generated, not a template editor

    A template editor makes you place every number by hand. TapVid builds the infographic from your report instead.

    • Built from your report
    • Export MP4

    How it works

    1

    Paste your data

    Stats, a report, a link, or a prompt.

    2

    AI builds the scenes

    Counting numbers, charts, and pacing, generated for you.

    3

    Refine and export

    Tweak by prompt, then export an MP4.

    What you can make

    One generator covers the infographic formats teams reach for, from a single stat highlight to a full report recap.

    Stat and data highlights

    A run of key numbers that count up on screen, one figure at a time.

    Animated charts

    Bar, line, and pie charts that build as you narrate, instead of sitting flat on a slide.

    Timeline and process infographics

    A sequence or a roadmap that draws itself step by step.

    Report and survey recaps

    Turn a long report or survey into a short video that carries the findings.

    Comparison infographics

    Two options side by side, revealed so the difference is clear.

    Social infographic clips

    Short data clips sized for reels, shorts, and feeds.

    Why make infographic videos with TapVid

    Generated from your data, not a template

    The scenes are built from your stats and report, so the video is about your numbers, not a preset thousands of others used.

    Charts that animate on screen

    Numbers build, bars grow, and lines draw, so the data reads as a story instead of a static image.

    No designer, no After Effects

    Skip the timeline and the drag-and-drop. Describe the infographic and generate it.

    Refine by prompt

    Swap a chart, change the order, or reset the emphasis in plain language.

    From a full report to a clip

    Hand it a whole report and get back a short video, so the recap does not take a week.

    On-brand and reusable

    Keep one look across a set of clips so a series reads as one campaign.

    Infographic videos made with TapVid

    Real output generated from stats and reports, no manual placement.

    Infographic video maker vs. a template editor

    A template editor gives you a grid of pre-built infographic scenes, then asks you to place every number, icon, and chart by hand and hope your data fits the layout. TapVid generates the infographic from your content instead. You paste the stats or the report, and it builds the counting numbers, the charts, and the pacing around what you actually have. If the first pass is off, you change it with a prompt rather than dragging elements around a canvas.

    Who makes infographic videos

    Business & reports

    Turn a quarterly report or a survey into a video stakeholders will actually watch.

    Marketing & social

    Data clips and stat posts that stop the scroll on reels and feeds.

    Learning & education

    Explain numbers and concepts with motion so they are easier to follow.

    Frequently Asked Questions

    An infographic video maker turns information into a short animated video. With TapVid you paste your stats, a report, or a prompt, and it generates a video where the numbers count up and the charts build.
    Yes. You paste your stats, a link, or a whole report, and TapVid reads what matters and builds the infographic scenes from it.
    You paste your numbers or describe the data in your prompt, and TapVid builds the charts from that. There is no dedicated spreadsheet importer, so if you are working straight from a CSV and only need charts, the animated chart maker is the closer fit.
    You export an MP4. That is the export format today, and it plays anywhere you post a video.
    TapVid runs on credits, so check the pricing page for what is included right now. Exported videos carry a small TapVid watermark in the bottom-right corner, and paid plans remove it.
    No. TapVid generates the layout, the charts, and the pacing, so you do not place elements by hand or open animation software.
    The animated chart maker is the spreadsheet-first page, for turning a table of numbers into a chart video. The infographic video maker works from reports, stats, and prompts, and mixes charts with numbers, icons, and text.

    Related guides

    • See all plans and pricing→
    • Infographic Video Guide→
    • Animated Chart Maker→
    • Document to Video Guide→
    • AI Motion Graphics Generator→
    • Text to Motion Graphics→
    • AI Explainer Video Generator→
    • Text to Video AI→

    Simple, credit-based pricing

    3 credits = 1 second, so you only pay for what actually renders. Start free, upgrade anytime.

    Most Popular

    Pro

    $49/mo

    2,000 credits / mo

    Max

    $99/mo

    6,000 credits / mo

    Ultra

    $199/mo

    14,000 credits / mo

    See full plans & pricing →

    Need help making a better video?

    Follow tutorials, study good cases, or ask TapVid support.

    Join Discord→

    Ready to create your first video?

    Join thousands of product teams using AI to create professional videos in minutes.

    Your first video in under 5 minutes →Book a demo →
    Tapvid

    TapVid turns the materials your business already has into an accurate video that explains the job clearly and is ready to publish.

    TikTokInstagramXDiscordYouTube

    TapVid

    Features

    AI Explainer Video GeneratorAI Motion Graphics GeneratorAI Product Demo Video GeneratorProduct Demo Video MakerExplainer Video TemplatesVideo Production Plan TemplateVideo Creative Brief TemplateCorporate Video TemplateVideo Sales Letter TemplateVideo Production Proposal TemplatePromo Video TemplateVideo Production TemplateAI Product Video GeneratorAI B-Roll GeneratorTalking Head EditingClone VideoPrompt to VideoText to Video AIText to Motion GraphicsAnimated Video MakerAnimated Explainer Video MakerKinetic Typography GeneratorAnimated Chart MakerAnimated Collage MakerFree AI Video Generator

    Convert to Video

    Screenshot to VideoImage to VideoAssets to VideoAudio to VideoVideo to Video AIPDF to VideoPPT to VideoArticle to VideoBlog to VideoURL to VideoScript to VideoGoogle Slides to VideoWord to Video

    Use Cases

    SaaS Explainer VideoSaaS Video ProductionIndustrial Video ProductionProduct Launch Video MakerAI Ad Video GeneratorDocumentary Video MakerAnimated Social Media Video MakerInfographic Video MakerPodcast to VideoWhiteboard Animation MakerWhiteboard Explainer VideoEcommerce Video AdsStartup Explainer VideoEducational VideoTutorial VideoCustomer OnboardingHelp Center VideoAPI Docs Video

    Solutions

    Explainer VideoProduct Demo VideoMeeting Recap VideoWebinar ClipsMarketing VideoFeature AnnouncementCompetitive ComparisonNewsletter VideoLanding Page VideoInvestor Pitch Video

    Featured Guides

    Video Prompt LibraryBest Faceless YouTube NichesCollage Animation Guide

    Company

    All FeaturesAboutBlogPricingGet in Touch

    © 2026 TapVid. All rights reserved.

    Privacy
    Terms of Service