

Our science communication team produces infographic videos for research institutions and technology companies — content that needs to make data and findings accessible to a non-expert audience. The format sits between traditional explainer video and static infographic design, and it is genuinely harder to do well than either of its parents. What follows is our production process, refined across three years of client work.
01
What makes infographic video different from a regular explainer
A standard explainer video uses animation to illustrate a concept — the visual supports the narration. An infographic video uses animation to reveal data — the visual IS the argument. This distinction changes everything about how you structure the content.
In an infographic video, the data needs to be correct in a way that simply is not required in conceptual explainer content. A diagram that is slightly inaccurate does not undermine an explainer. A chart that misrepresents data in an infographic video destroys credibility and can cause real harm, particularly in research and medical contexts.
The sequential reveal — the way data points appear progressively rather than all at once — is what separates infographic video from a static infographic. Done well, it creates a visual argument with a beginning, middle, and end. Done poorly, it is just a chart with unnecessary animation.
02
Choosing what data to visualize
- Lead with impact: the single most significant finding should be your visual opening — everything else builds context around it
- Three data points maximum per scene: more than three forces the viewer to read rather than watch
- Avoid tables in motion: tables require sustained attention — convert them to comparative bar charts or ranked lists for video
- Show trends as line or area charts, comparisons as bar charts, compositions as pie or treemap, relationships as scatter plots
- Distinguish between "data to show" and "data to support" — show the headline finding, support with one key backing statistic
03
Script structure for infographic video
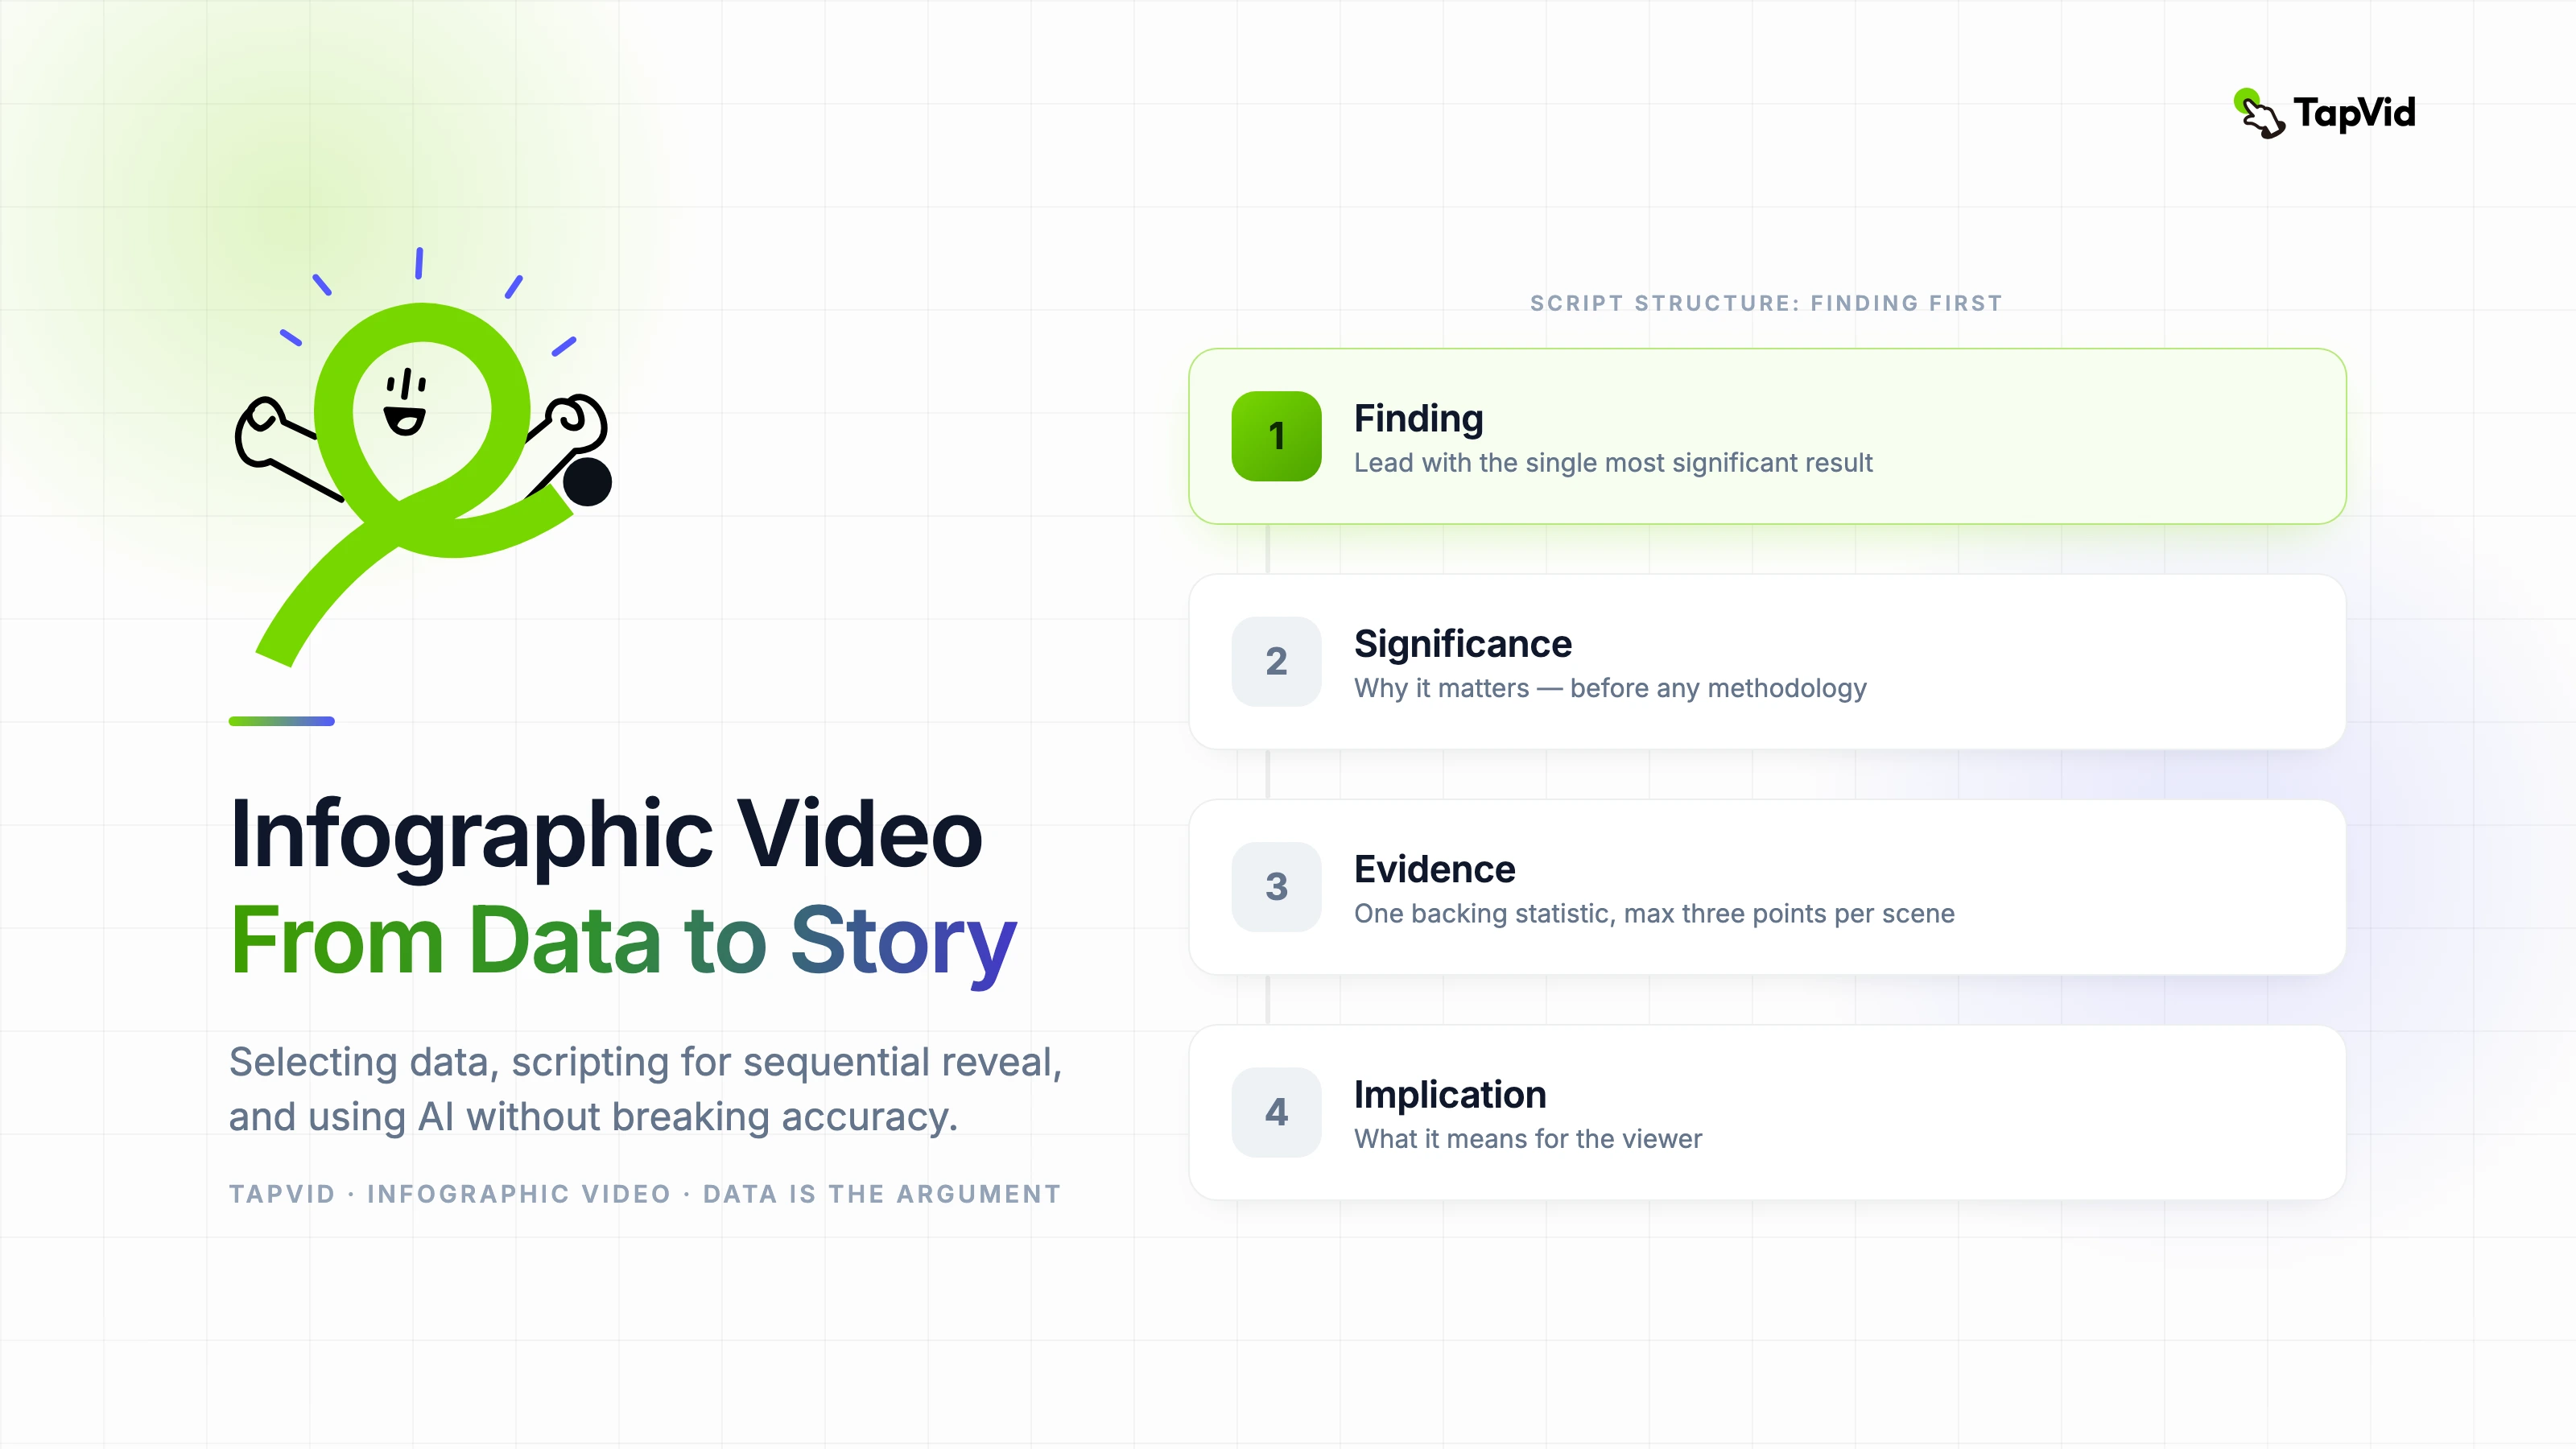
Start with the finding, not the methodology. Audiences engage with conclusions; they tolerate methodology only when they already care about the conclusion. The structure that works is: finding → significance → evidence → implication. Never: background → methodology → data → conclusion.
Each scene in an infographic video should answer a single question. Write the question at the top of your scene notes, then check that your visual and narration answer it directly. If a scene requires more than one question, split it into two scenes.
Pacing for infographic video runs slower than standard explainer video — around 90 to 110 words per minute in narration. Data visualization needs processing time. If your audience is trying to read a chart while listening to narration, they will do neither well.
04
Using AI tools in infographic video production
AI tools are genuinely useful in infographic video production for generating motion, voiceover, and background visuals. They are not useful — and can be actively harmful — for generating or interpreting data. Never use AI to derive statistics, summarize research findings, or create data that will be presented as factual in a video.
The workflow that works: human-verified data and script, AI-generated motion and visual treatment, human QC pass on every data element before publication. The AI saves time on production; the human maintains accuracy on content.
For chart animation specifically, tools like Flourish and Datawrapper produce clean animated chart output that can be composited into AI-generated surrounding visuals. This hybrid approach gives you accurate data visualization with AI-quality motion design around it.
05
Motion principles for data visualization
- Sequential reveal: always animate data appearing in reading order — left to right, bottom to top for bar charts, chronologically for time series
- Emphasis timing: pause on the most important data point for one to two seconds before continuing — the pause signals significance
- Directional animation: growth upward, decline downward, increase rightward — motion direction should reinforce the data's meaning
- Avoid simultaneous animation: if three bars are growing at the same time, the viewer cannot compare them — animate sequentially or with a clear lead element
- Consistent speed: all similar chart elements should animate at the same speed — inconsistent speed implies unequal importance
06
Where infographic videos perform best
LinkedIn is the highest-performing platform for research-based infographic video. The audience is professionally oriented, data literacy is high, and the algorithm rewards content that generates extended engagement. A well-produced infographic video on a relevant research finding consistently outperforms text posts and static images on dwell time.
Conference and event presentations benefit significantly from infographic video inserts — a sixty-second animated data summary is more memorable than a static slide and more credible than verbal description. Repackage your infographic video content as a looping display for exhibition contexts.
YouTube serves long-form infographic content well when the topic has search volume. Tutorials on how to interpret specific data, explainers on research findings in consumer-relevant categories, and annual trend reports in video format all perform well in search.