TapVid

Turn existing business content into clear video

Use product footage, narration, documents, and approved copy to make an accurate video that is ready to publish.

Log in
    TapVid
    HomeAPI & MCPPricingBlogAbout

    Animated Chart Maker

    Turn your verified numbers into animated charts for an explainer video. Create bar races, line reveals, and KPI counters without building a motion-design timeline.

    Create better videos with the TapVid community

    Tutorials

    Step-by-step workflows

    Good cases

    See what works

    Support

    Get answers

    Join Discord→

    What is an animated chart maker?

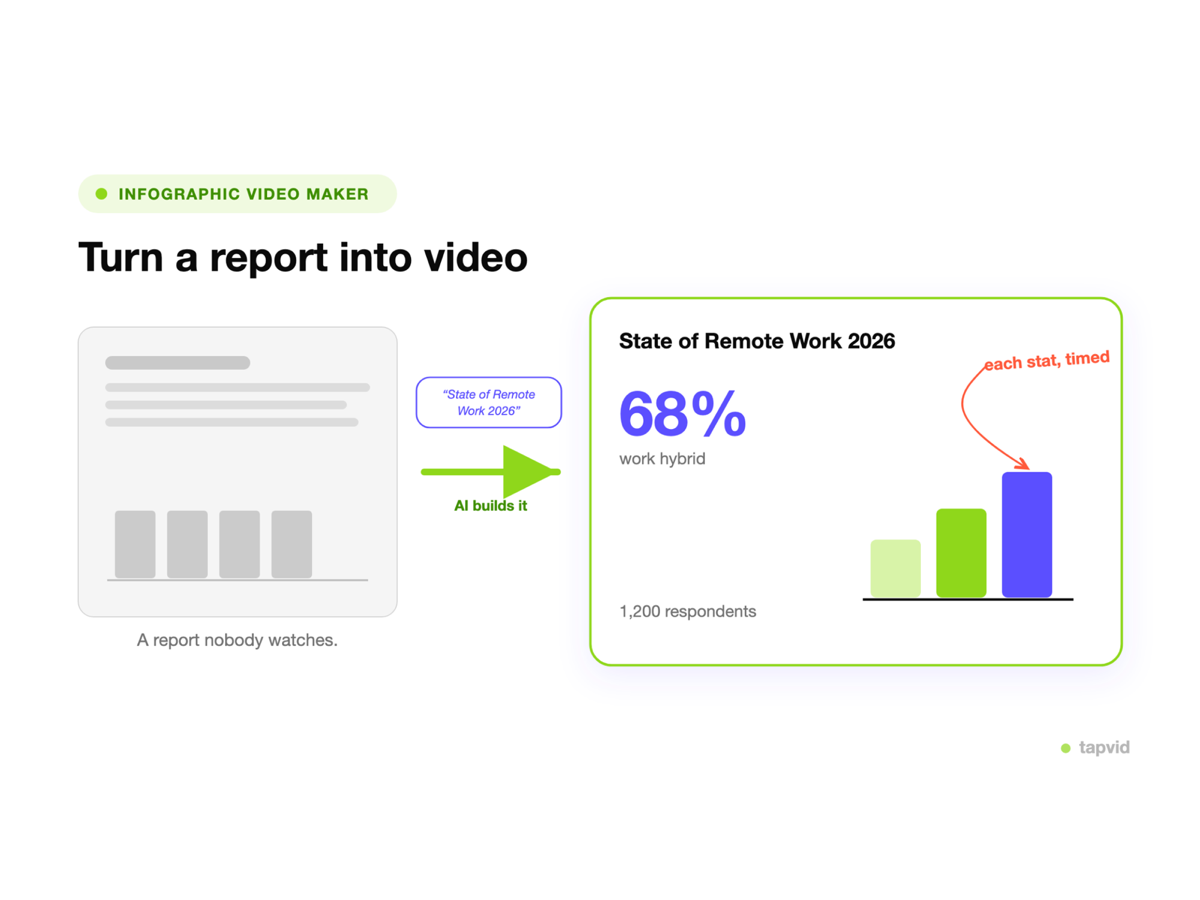
    An animated chart maker turns verified numbers into a chart that moves. Instead of a static image you drop into a slide, you get a data visualization video: bars that grow into place, lines that draw themselves on, and counters that tick up. Paste the figures or describe the chart you need, and TapVid builds the animation, so work that normally needs After Effects or a motion designer happens in one pass.

    Numbers are easier to feel when they move. A quarter-over-quarter jump lands harder as an animated bar than as a row in a table, and a ranking is clearer as a bar chart race than as a static list. The problem has always been production: animating a chart by hand is slow and technical, which is why most teams screenshot a spreadsheet and move on. TapVid generates the motion for you and keeps the data editable.

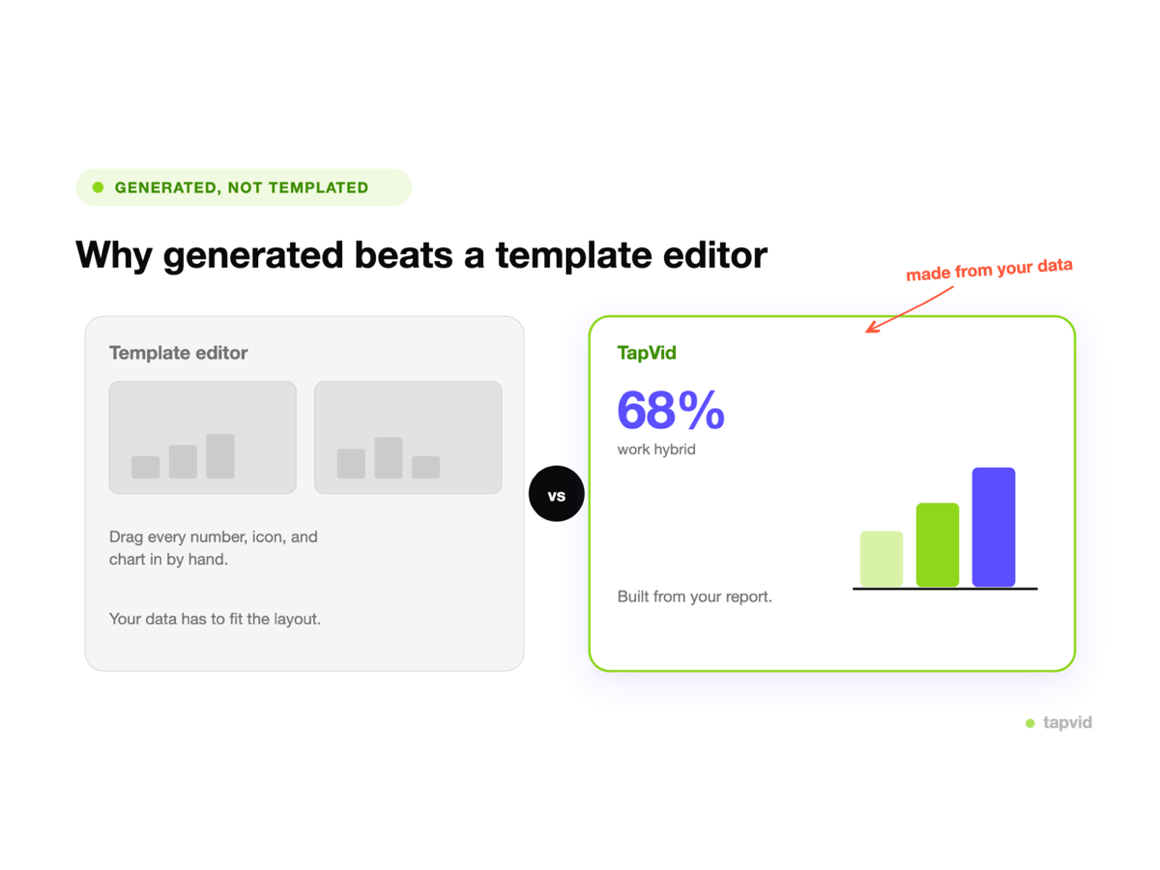
    Because every chart is built from your own data, the result matches your report instead of a template. You choose the chart type, the colors, and the pacing, and you can change a value or a label by prompt and re-render, so a last-minute data fix does not mean rebuilding the video.
    From data in to an animated chart out

    Pasting verified numbers to generate an animated chart in TapVid

    Start with verified numbers and a clear message

    Paste the values you have already checked and describe the comparison or trend the viewer needs to understand. You start from approved data, not a blank motion-design timeline.
    • Verified, pasted numbers
    • Automatic chart-type suggestion
    An AI-generated animated bar chart race and KPI counters

    AI animates the chart for you

    Pick bar race, line reveal, KPI counter, or pie and donut, and TapVid animates it: bars grow, lines draw on, and numbers count up, paced like a data story rather than a flat slide.
    • Bar races, line reveals, KPI counters
    • Animation generated, not screen-recorded
    Restyling an animated chart with a text prompt and exporting an MP4

    Restyle by prompt, then export

    Change colors, units, labels, or pacing by describing it, then export an MP4 to drop into a deck, a reel, or a report. Fix a number and re-render in seconds.

    • Edit labels and colors by prompt
    • Export MP4 to use anywhere

    How it works

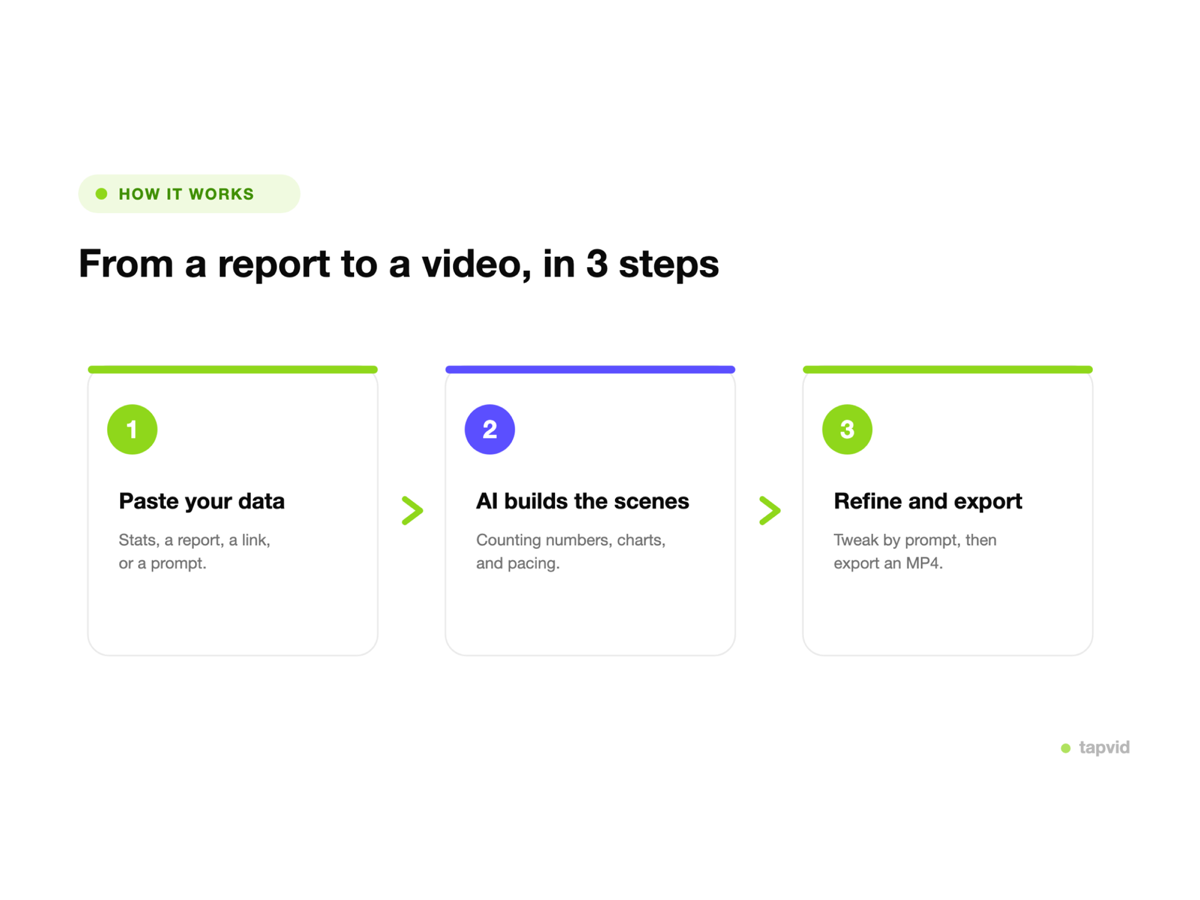
    1

    Paste verified numbers

    Paste the figures you have checked and describe the comparison or trend to show.

    2

    AI builds your chart

    TapVid picks a chart type and animates it: bars grow, lines draw on, and counters count up.

    3

    Refine and export

    Change colors, units, labels, or pacing by prompt, then export an MP4.

    What you can make with the animated chart maker

    One generator covers the data videos teams reach for most, from a single animated KPI to a full bar chart race.

    Earnings and quarterly updates

    Turn revenue, growth, and margin numbers into animated bars and counters for a board deck or an investor update.

    Investor and research data

    Make market sizes, comparisons, and trends move so a research point reads in seconds instead of a dense table.

    Social data hooks

    Open a post or a reel with a stat that animates on screen, the kind of hook that stops the scroll.

    Bar chart races

    Rank anything over time, from market share to follower counts, as a bar chart race that plays out on its own.

    KPI dashboard videos

    Turn the metrics that matter into counters and reveals for an all-hands recap or a weekly update.

    Survey and poll results

    Animate percentages and breakdowns from a survey into pie, donut, and bar charts people actually watch.

    Why make animated charts with TapVid

    Generated from your data, not hand-animated

    Give it verified numbers and a clear chart brief, and it produces the animation. No After Effects, no data-viz library, no keyframing.

    Edit the data, not the video

    Change a value, a label, or a unit by describing it and re-render. A data correction takes seconds instead of a full redo.

    Chart types that fit the story

    Bar races, line reveals, KPI counters, and pie or donut charts, chosen automatically or picked from the style row.

    Built to drop into a video

    Export an MP4 that plays in a deck, a reel, or a report, not just an embed that only lives on a web page.

    On-brand colors and pacing

    Steer the colors, units, and timing with a prompt and keep a consistent look across a set of charts.

    Minutes instead of a motion designer

    Turn a chart that used to take a specialist hours into something you finish in an afternoon.

    Animated charts made with TapVid

    Real output generated from data, no manual animation.

    Animated charts vs. static chart tools and screen recordings

    Static tools embed a chart on a web page; a screen recorder just captures whatever is already on screen. TapVid generates the animated chart as an editable video from your data, so you can fix a number and re-render in seconds.

    Static chart tools (Flourish)Screen recording (CapCut)TapVid
    OutputWeb embedScreen recordingEditable MP4
    AnimationStatic imageOnly what you recordGenerated for you
    Change the dataRe-embedRe-recordBy prompt, re-render
    Restyle colors & labelsManualNoBy prompt
    Skills neededChart setupVideo editingNone
    Use in a deck or reelScreenshot itYesYes, as MP4

    What teams build with it

    Finance & reporting

    Animated earnings, KPI, and quarterly-update charts for board decks and investor updates.

    Research & analytics

    Turn market data, trends, and comparisons into data videos that make a finding obvious.

    Marketing & social

    Stat hooks, bar chart races, and survey results that stop the scroll and get shared.

    Frequently Asked Questions

    No. Paste the verified numbers and describe the comparison or trend you want to show. TapVid turns that brief into an animated chart, so you do not build the motion by hand.
    You can generate bar chart races, animated bar and column charts, line reveals, KPI and counter animations, and pie or donut charts. TapVid picks a fitting type automatically, or you can choose one from the style picker.
    A data visualization video is a chart that moves: bars grow, lines draw on, and numbers count up over time, instead of sitting still on a slide. It turns a report or a spreadsheet into something a viewer watches and remembers, and it plays anywhere a video does.
    You can export a finished MP4 to publish or drop into a deck, a reel, or a report. Transparent-background export for overlaying an animated chart on top of other footage is on the roadmap; check the current export options in the app.
    Flourish makes charts you embed on a web page, not a video you can drop into a deck or a reel. Screen-recording a chart in a tool like CapCut captures whatever is on screen but cannot generate the animation or change the data. TapVid generates the animated chart as an editable video, so you change the numbers, labels, colors, and pacing by prompt and re-render.
    Yes. Update a value, a label, a unit, or a color by describing the change, and TapVid re-renders the animation. You are editing the chart, not re-cutting a video, so a data correction takes seconds instead of a redo.
    Most animated charts run 10 to 30 seconds, long enough for the animation to land and short enough for social or a slide. You can ask for a tighter cut or a longer, multi-chart sequence.
    No. You do not need After Effects, a data-viz library, or animation experience. You give TapVid the numbers, pick a look, and refine it in plain language.

    Related guides

    • See all plans and pricing→
    • Infographic Video: The Complete Guide→
    • AI Motion Graphics Generator: The Complete Guide→
    • Motion Graphics for Social Media→
    • Motion Graphics Software Comparison→
    • The Animation Video Maker Playbook→
    • How AI Animation Software Works→

    Simple, credit-based pricing

    3 credits = 1 second, so you only pay for what actually renders. Start free, upgrade anytime.

    Most Popular

    Pro

    $49/mo

    2,000 credits / mo

    Max

    $99/mo

    6,000 credits / mo

    Ultra

    $199/mo

    14,000 credits / mo

    See full plans & pricing →

    Need help making a better video?

    Follow tutorials, study good cases, or ask TapVid support.

    Join Discord→

    Ready to create your first video?

    Join thousands of product teams using AI to create professional videos in minutes.

    Your first video in under 5 minutes →Book a demo →
    Tapvid

    TapVid turns the materials your business already has into an accurate video that explains the job clearly and is ready to publish.

    TikTokInstagramXDiscordYouTube

    TapVid

    Features

    AI Explainer Video GeneratorAI Motion Graphics GeneratorAI Product Demo Video GeneratorProduct Demo Video MakerExplainer Video TemplatesAI Product Video GeneratorAI B-Roll GeneratorTalking Head Video EnhancerAI Video ClonerText to Video AIText to Motion GraphicsAnimated Video MakerAnimated Explainer Video MakerKinetic Typography GeneratorAnimated Chart MakerAnimated Collage MakerFree AI Video Generator

    Convert to Video

    Image to VideoVideo to Video AIPDF to VideoPPT to VideoArticle to VideoBlog to VideoURL to VideoScript to VideoGoogle Slides to VideoWord to Video

    Use Cases

    SaaS Explainer VideoProduct Launch Video MakerAI Ad Video GeneratorDocumentary Video MakerAnimated Social Media Video MakerInfographic Video MakerPodcast to VideoWhiteboard Animation MakerEducational VideoTutorial VideoCustomer OnboardingHelp Center VideoAPI Docs Video

    Solutions

    Explainer VideoProduct Demo VideoMeeting Recap VideoWebinar ClipsMarketing VideoFeature AnnouncementCompetitive ComparisonNewsletter VideoLanding Page VideoInvestor Pitch Video

    Featured Guides

    Video Prompt LibraryBest Faceless YouTube NichesCollage Animation Guide

    Company

    All FeaturesAboutBlogPricingGet in Touch

    © 2026 TapVid. All rights reserved.

    Privacy
    Terms of Service