
“Video engagement rate” is not one universal metric. Wistia defines average engagement as the share of available video time watched across plays. Vidyard's 2025 benchmark describes the share of viewers who stay engaged to the end. Social platforms may use likes, comments, shares, or milestone views instead. Putting those numbers in one ranking without preserving the formula creates a false benchmark. We normalized eight published data points from two first-party video-platform reports. Wistia's benchmark sheet reports average engagement from 50% for videos under one minute to 16% for videos over 60 minutes. Vidyard's 2025 Video in Business Benchmark reports 65% of viewers staying engaged to the end for videos under one minute and 20% for videos over 20 minutes, based on anonymized customer data covering 943,305 videos created in 2024. The directional pattern is consistent: shorter videos retain a larger share of their runtime. The percentages are not directly comparable because the definitions, populations, buckets, and study periods differ.
01
Video engagement benchmarks at a glance
Video engagement benchmarks at a glance
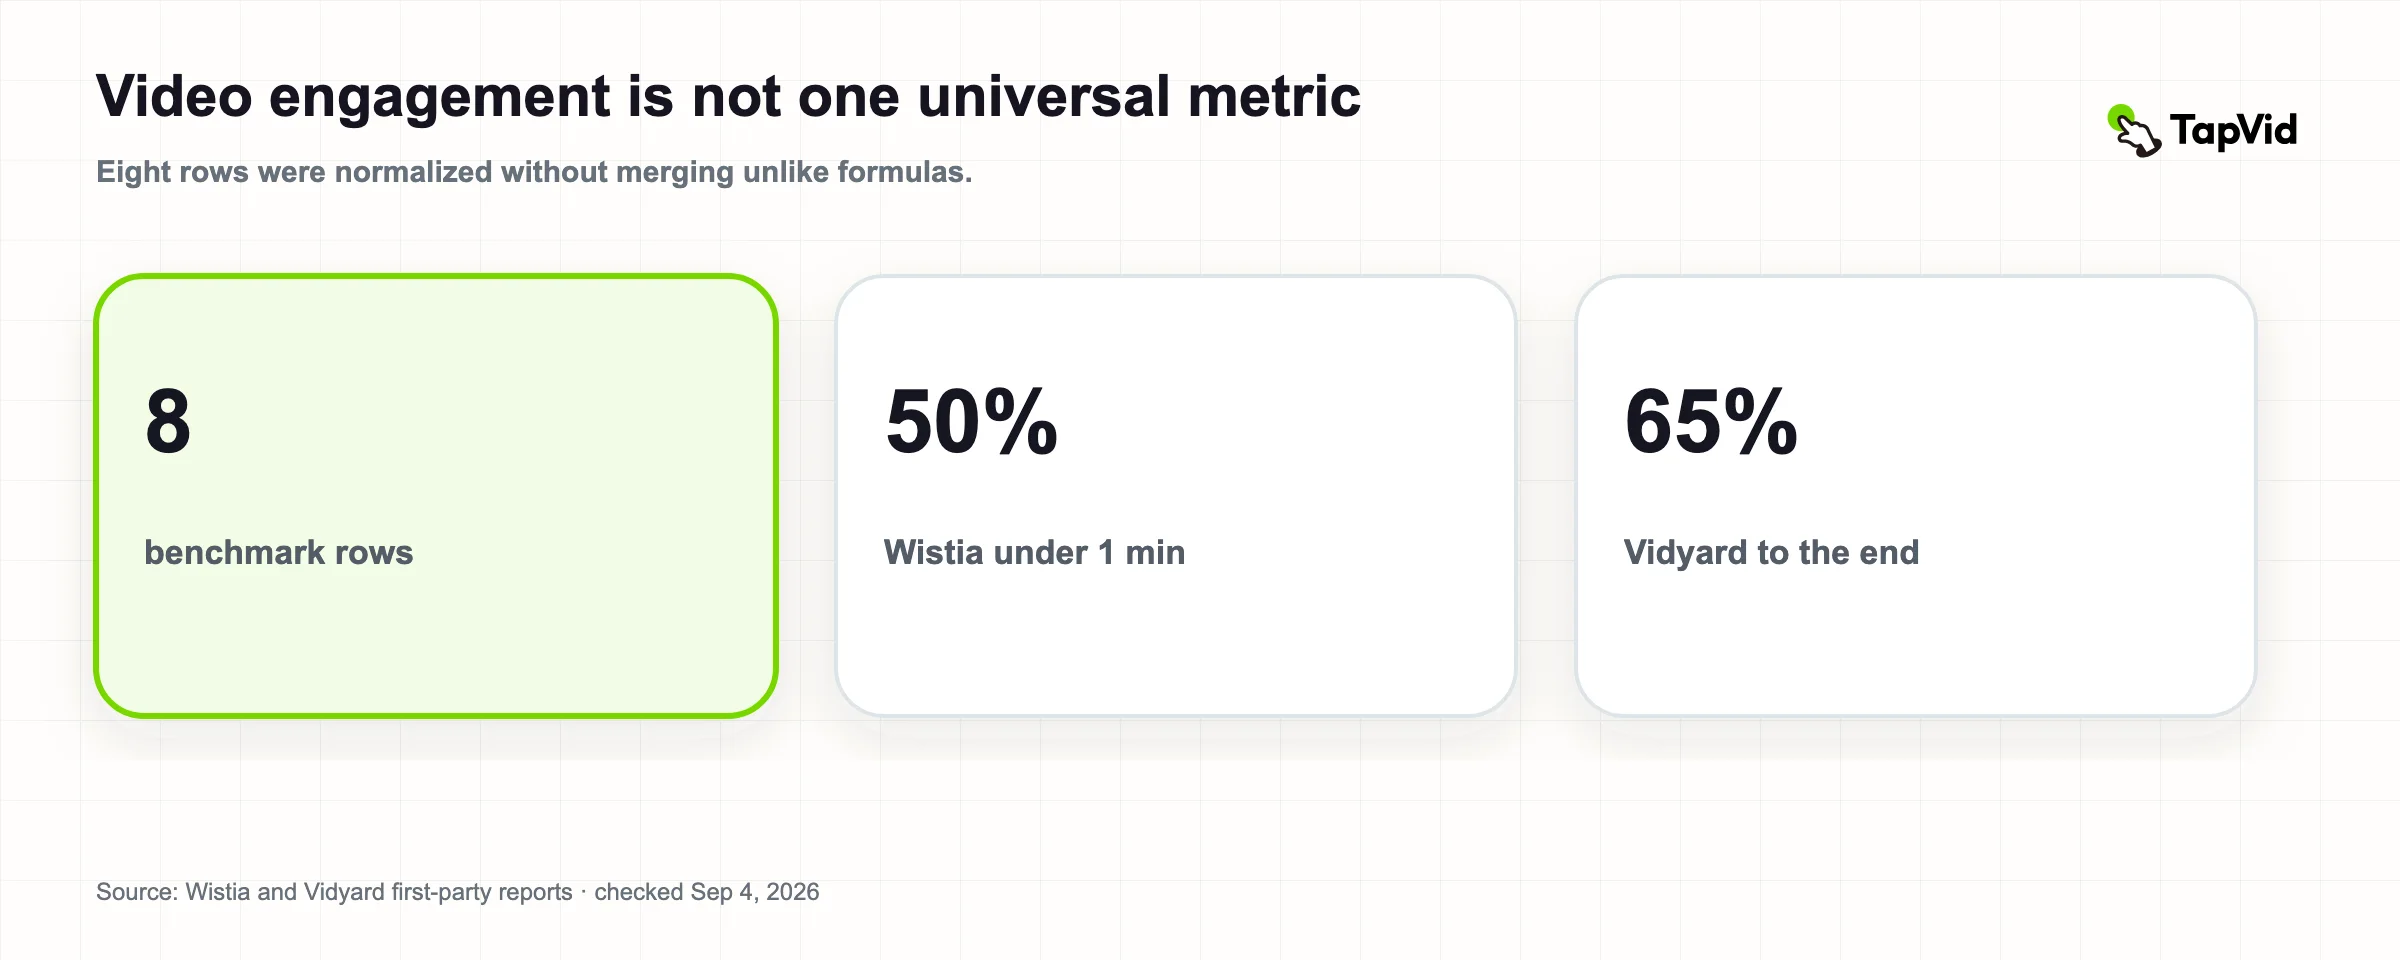
8
normalized benchmark rows
Six Wistia average-engagement buckets and two Vidyard end-retention endpoints
Wistia Video Engagement BenchmarksChecked 2026-09-04
50%
Wistia average engagement under one minute
Share of available watch time consumed, not share of viewers completing
Wistia Video Engagement BenchmarksChecked 2026-09-04
65%
Vidyard viewers retained to the end under one minute
End-retention statistic from a different platform population
Wistia Video Engagement BenchmarksChecked 2026-09-04
| Value | Finding | Metric boundary |
|---|---|---|
| 8 | normalized benchmark rows | Six Wistia average-engagement buckets and two Vidyard end-retention endpoints |
| 50% | Wistia average engagement under one minute | Share of available watch time consumed, not share of viewers completing |
| 65% | Vidyard viewers retained to the end under one minute | End-retention statistic from a different platform population |
Download the normalized video engagement benchmark dataset. Every row preserves publisher, metric name, definition, length bucket, value, sample or scope, study period, source URL, verification date, and comparability note.
Sources: Wistia Video Engagement Benchmarks, Wistia's metric definition, and Vidyard's 2025 Video in Business Benchmark, checked September 4, 2026.
Verification date:
- 2026-09-04
02
The eight benchmark rows
| Publisher | Metric | Length | Reported value |
|---|---|---|---|
| Wistia | Average engagement | Under 1 minute | 50% |
| Wistia | Average engagement | 1–3 minutes | 47% |
| Wistia | Average engagement | 3–5 minutes | 46% |
| Wistia | Average engagement | 5–30 minutes | 38% |
| Wistia | Average engagement | 30–60 minutes | 26% |
| Wistia | Average engagement | Over 60 minutes | 16% |
| Vidyard | Viewers retained to end | Under 1 minute | 65% |
| Vidyard | Viewers retained to end | Over 20 minutes | 20% |
Do not compare 50% and 65% as though Vidyard “wins.” A viewer can watch half of a video without completing it, and average watch-time share can be influenced by rewatches and by where viewers leave. The correct use is within-source and within-definition: compare a Wistia-hosted video with the relevant Wistia length bucket, or a Vidyard sales video with the relevant Vidyard context.
03
What Wistia calls average engagement
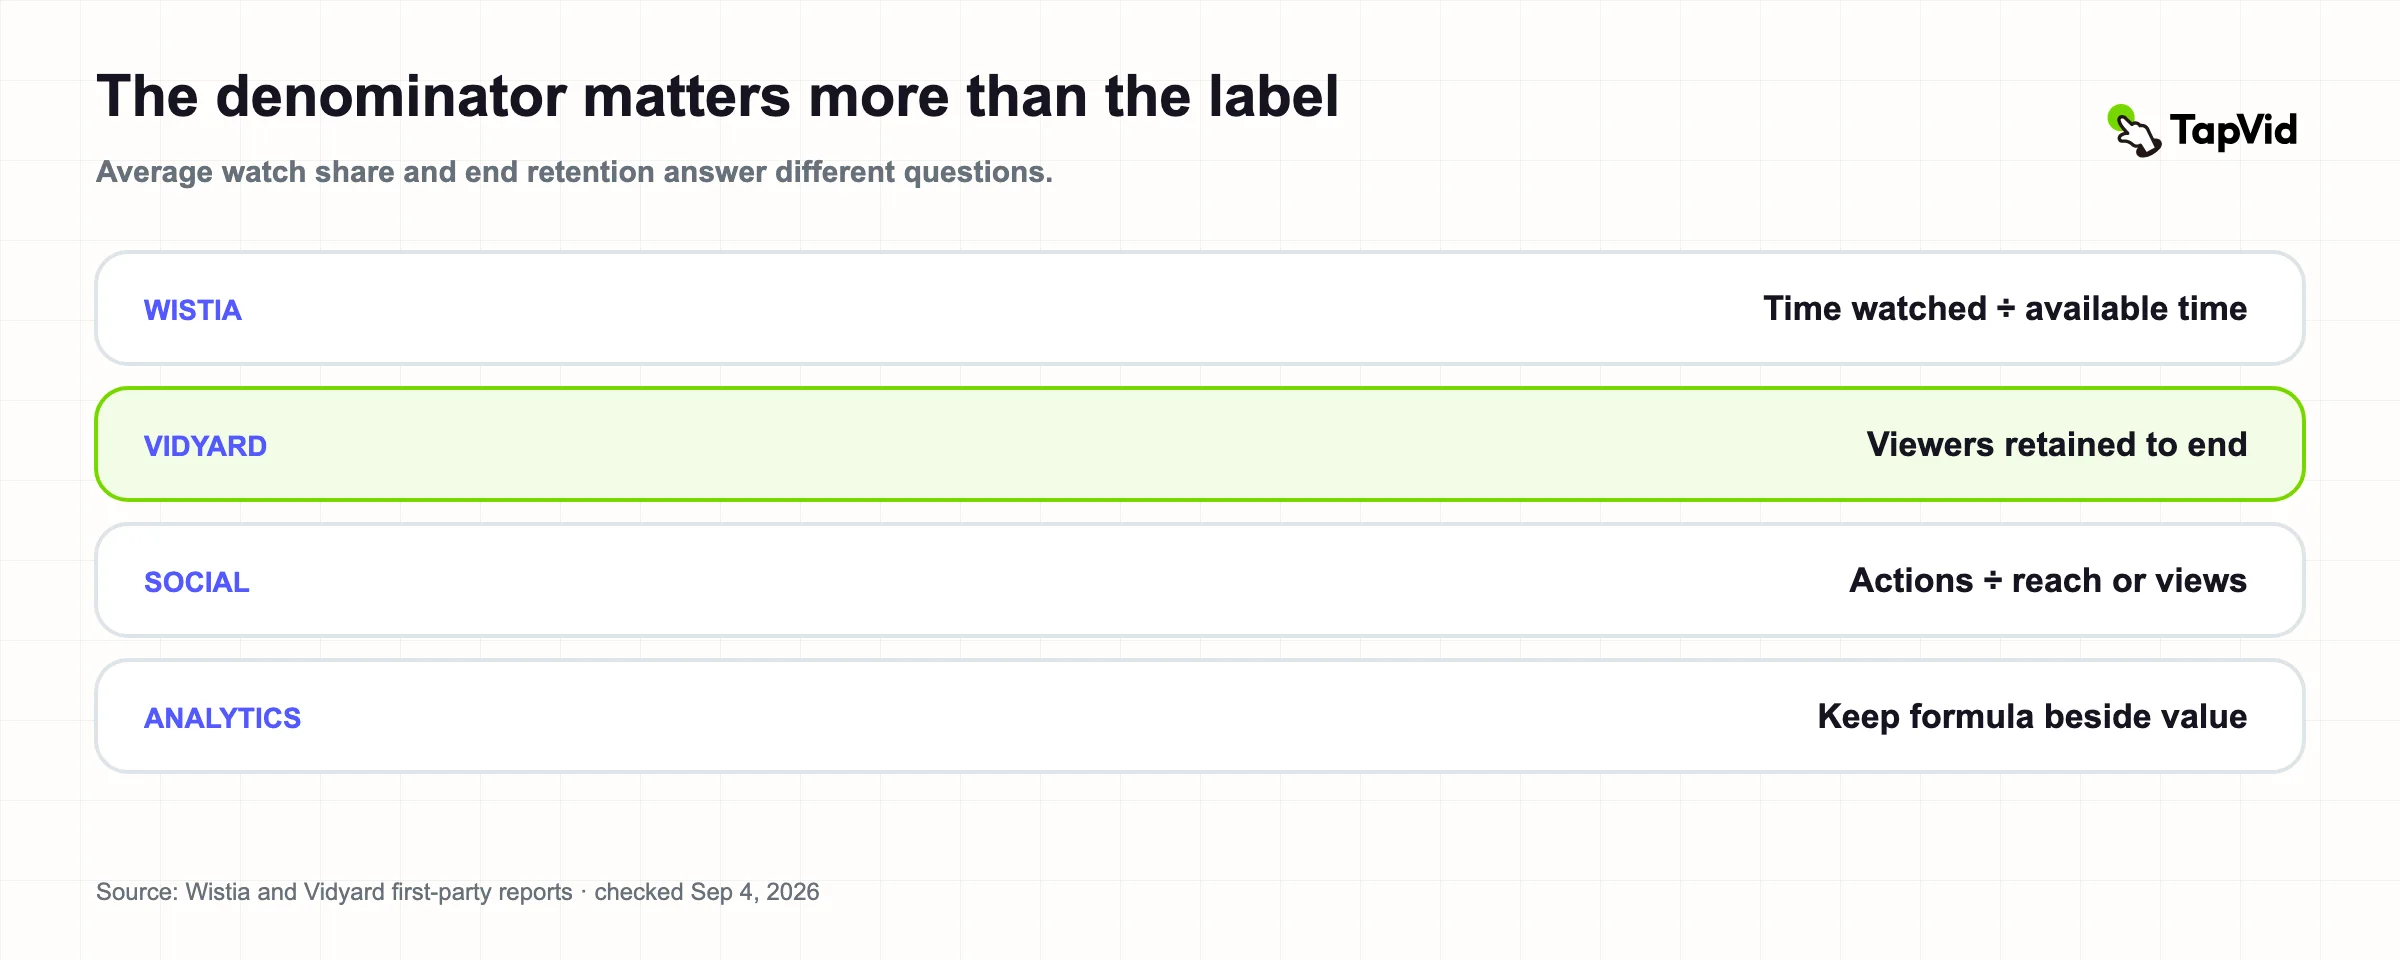
Wistia defines video engagement rate as total time played divided by the product of total plays and media length: total time played ÷ (total plays × media length). If a two-minute video is played 1,000 times and accumulates ten hours of played time, the resulting average engagement is 30% in Wistia's example.
That formula measures how much of the available runtime was consumed. It is richer than a view count because it distinguishes a quick start from sustained watching. It is not a completion rate and does not show how many individual viewers reached the final frame.
Wistia's benchmark sheet reports six length buckets. The decline is gradual through five minutes—50%, 47%, and 46%—then becomes larger for 5–30 minutes, 30–60 minutes, and over 60 minutes. Because the sheet does not state the exact sample size or study period, we preserve those fields as “not stated” instead of borrowing the 13-million-video sample from Wistia's separate 2026 report.
Wistia's 2026 State of Video report analyzed more than 13 million videos and 79 million hours of viewing, and it uses the same general engagement definition. It also says educational and tutorial videos lead by type, while industry and viewer intent materially affect performance. That evidence supports segmentation, not retroactive attribution of the 13-million sample to an undated benchmark sheet.
04
What Vidyard calls staying engaged to the end
Source: TapVid public research dataset; verified 2026-09-04.
Vidyard's 2025 Video in Business Benchmark analyzed anonymized customer data representing more than 940,000 videos; the page reports 943,305 videos created in 2024 and gives a study period from January 1 through December 15, 2024.
Its length comparison says 65% of viewers stay engaged all the way to the end when a video is under one minute. For videos over 20 minutes, the figure is 20%. Vidyard emphasizes that viewer intent also affects the result: short prospecting messages and longer demos or proposals serve different stages of a sales process.
The wording “stay engaged all the way to the end” describes end retention. The public page does not give the same mathematical definition as Wistia's watch-time share, so the dataset records it as a distinct metric rather than renaming it engagement rate.
05
Why the denominator matters more than the label
Before copying a benchmark, write the formula beside it. Common video metrics include:
- Play rate: people or page loads that started the video divided by eligible page exposure.
- Average engagement: time watched divided by plays multiplied by runtime.
- Completion rate: completions divided by starts, plays, views, or impressions, depending on the system.
- Social engagement rate: likes, comments, shares, saves, or clicks divided by reach, impressions, followers, or views.
- Average percentage viewed: average share watched among viewers who met the platform's view or engaged-view condition.
Two dashboards can both show “engagement rate” while answering different questions. A content team should keep a metric dictionary with event, unit, denominator, replay treatment, autoplay rule, reporting window, and platform.
06
A benchmark is a diagnostic, not a target
Suppose a four-minute product explainer records 42% average engagement. It sits below Wistia's published 46% average for the 3–5-minute bucket. That gap suggests an investigation; it does not prove the edit is bad.
Check at least four conditions:
1. Viewer intent. A person seeking one setup answer may leave after finding it and still have a successful experience. 2. Placement. An autoplaying home-page video and a clicked help-center tutorial do not start with the same commitment. 3. Traffic source. Paid cold traffic, branded search, a sales email, and an onboarding flow produce different audiences. 4. Outcome. A shorter watch can still produce a product click, qualified lead, completed task, or correct decision.
Use the benchmark to find videos that deserve review. Then inspect the engagement graph, rewatch spikes, early drop, CTA behavior, and downstream outcome.
07
Length changes the percentage, not the whole value
The normalized rows show a clear relationship between length and percentage watched, but percentage alone penalizes depth. A ten-minute video watched 38% on average generates about 3.8 minutes of watch time per play. A 45-second video watched 50% generates about 22.5 seconds.
The longer video may be more valuable if the viewer needs a technical explanation, product comparison, or buying committee briefing. The shorter video may be better for a single product promise in a feed. “Shorter has higher engagement” is therefore a descriptive pattern, not a command to cut every video below one minute.
The better rule is to make the video no longer than its information job. Remove repetition, front-load the reader's reason to continue, and split unrelated jobs into separate assets.
08
A measurement plan for explainer and product video
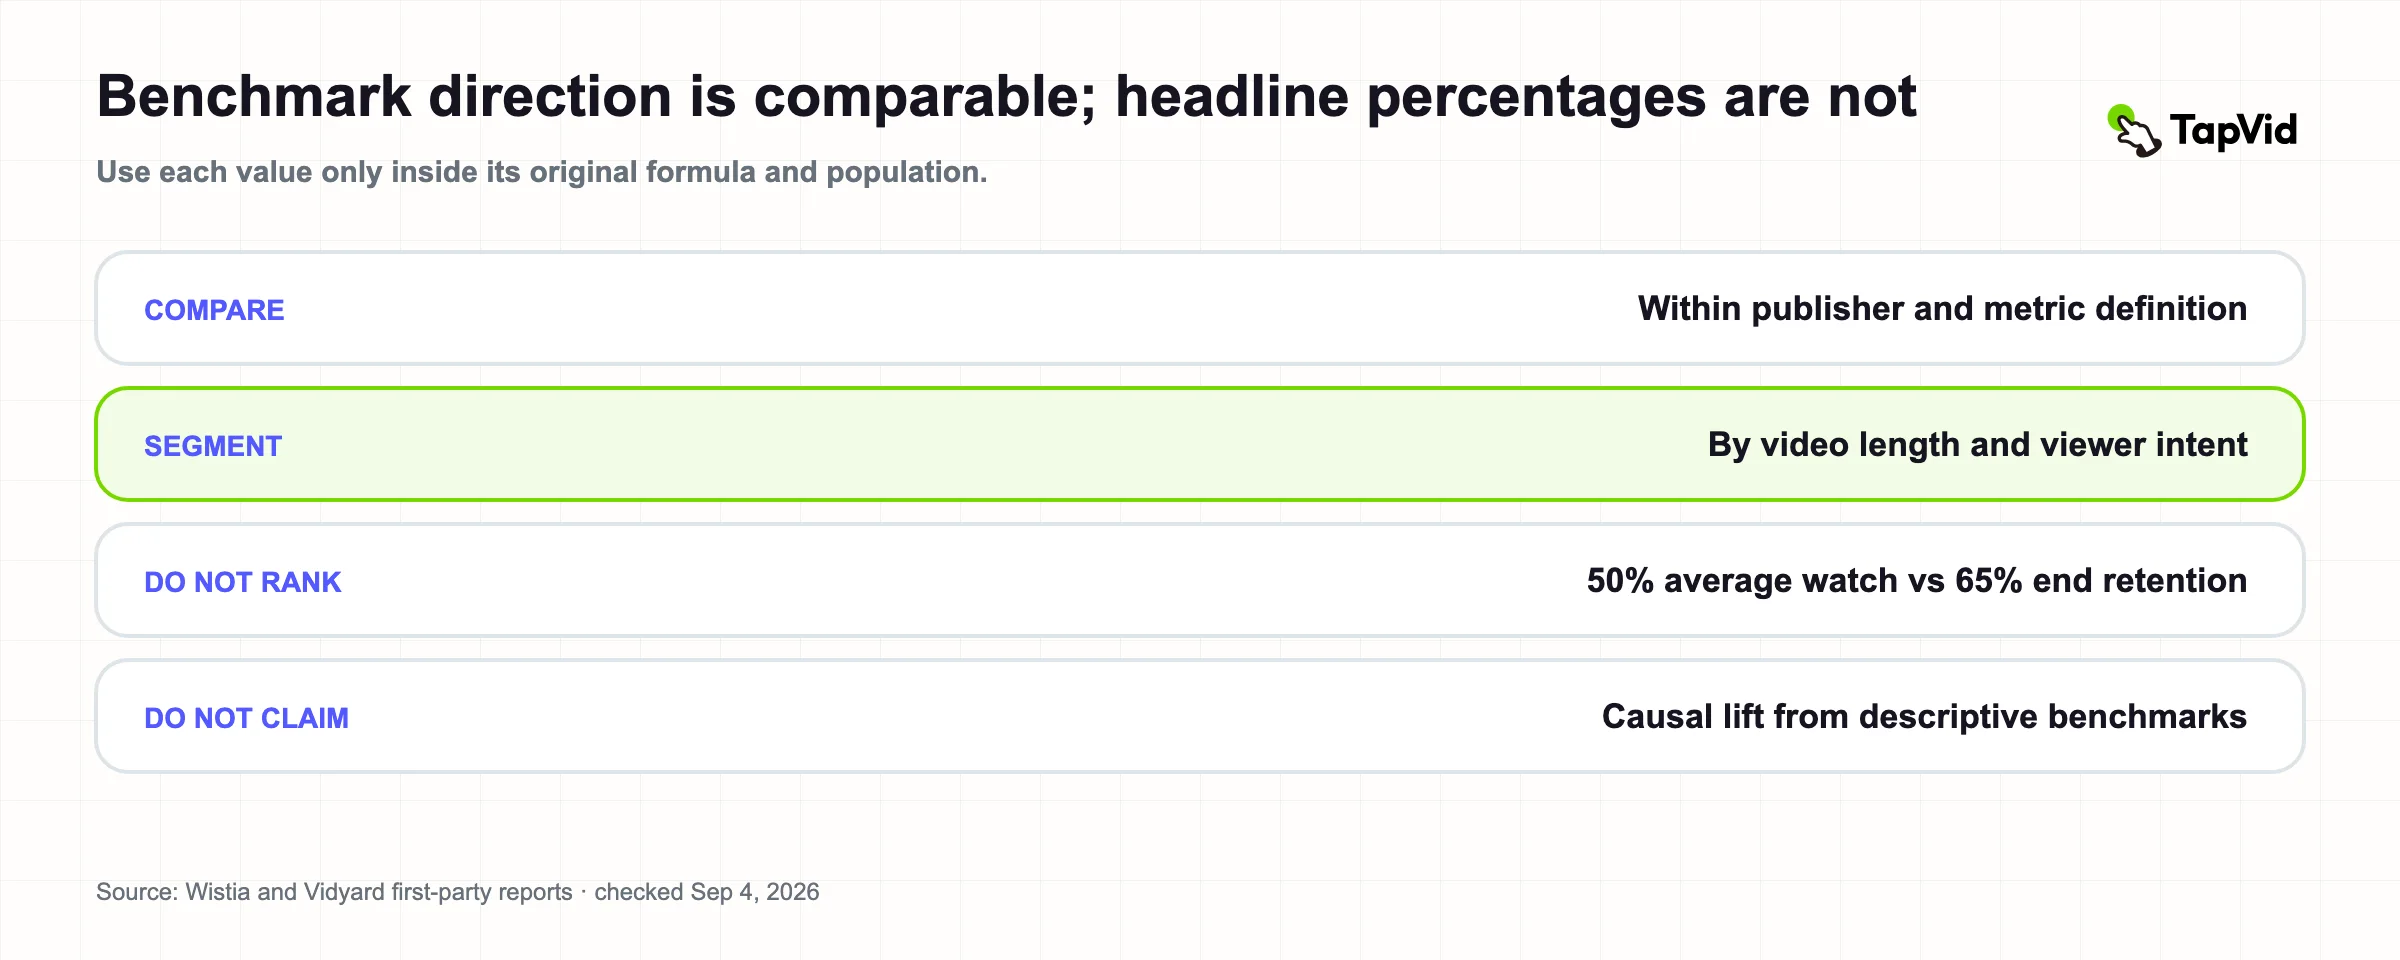
Source: TapVid public research dataset; verified 2026-09-04.
For an explainer video on a product page, track four layers:
| Layer | Metric | Question |
|---|---|---|
| Exposure | Eligible page loads and player visibility | Did the visitor have a chance to see the video? |
| Start | Unique plays and play rate | Did the framing earn attention? |
| Consumption | Average engagement, quartiles, completion | Did the explanation hold attention? |
| Outcome | Product click, demo request, signup, assisted conversion | Did the viewer do the intended next action? |
Keep the approved product image, exact claim, and CTA stable when testing pacing or visual treatment. If the message changes at the same time as the edit, the result cannot isolate what improved engagement.
TapVid is an Explainer Video Engine for turning supplied assets and written copy into structured video. The source truth remains reviewable before delivery, and a specific scene can be revised without treating the whole video as a new random draw. That makes controlled variants more feasible, but it does not guarantee engagement. Real audience behavior remains the test.
09
Methodology
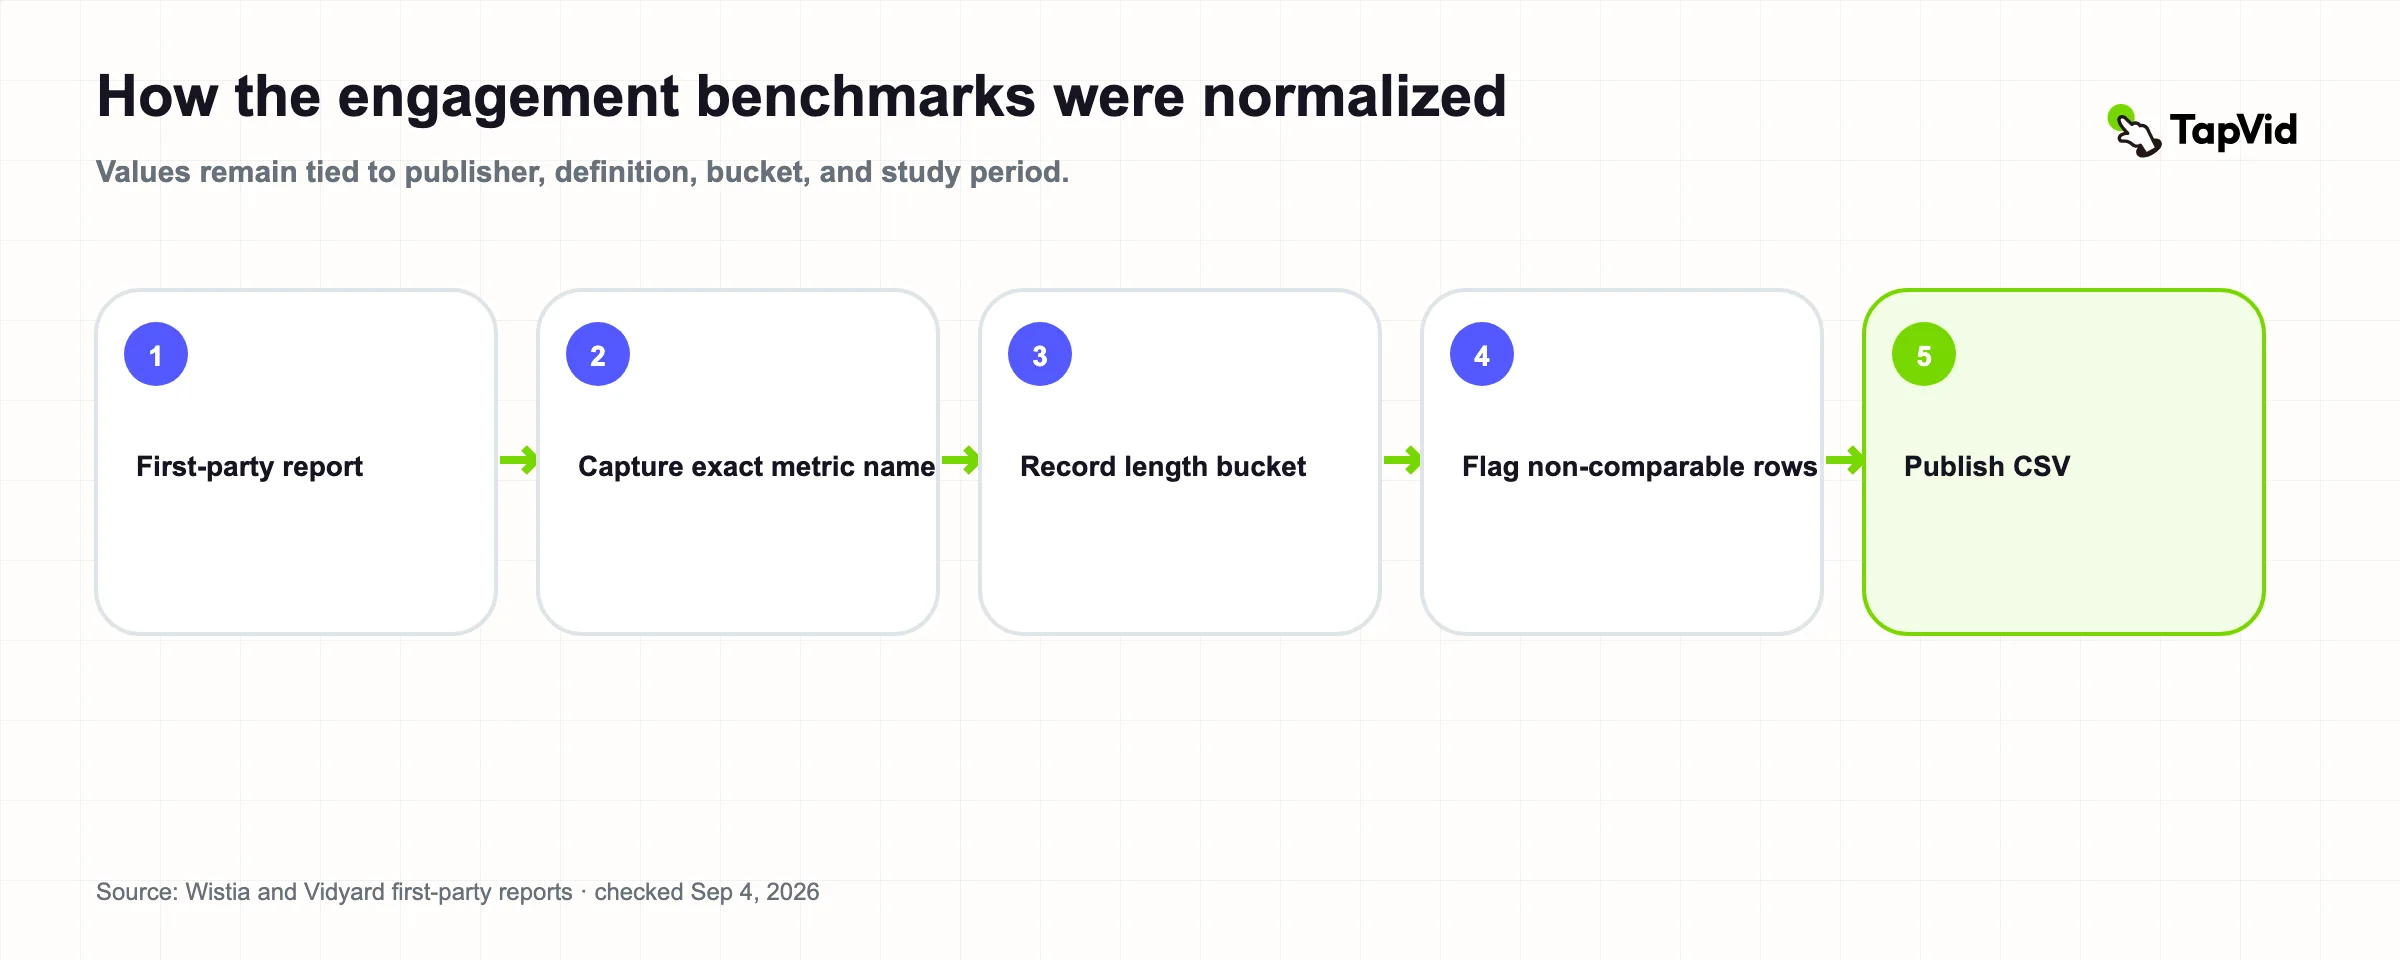
Source: TapVid public research dataset; verified 2026-09-04.
We selected publicly accessible first-party benchmark pages that expose a length bucket and a numeric video-consumption result. We transcribed six Wistia average-engagement rows and two Vidyard end-retention rows. We did not average, rank, or fit a trend across publishers.
Every row records the publisher's metric label and definition, length bucket, value, disclosed sample or scope, study period, source URL, and a comparability warning. The Wistia sheet's exact sample and period are recorded as not stated. Vidyard's public methodology describes anonymized customer data and the January 1–December 15, 2024 window. Sources were checked September 4, 2026. Dataset version: 1.0.
10
Limitations
The sources describe customers of two business-video platforms, not a random sample of all online video. Wistia and Vidyard serve different use cases and publish different formulas. Length buckets do not align. Autoplay, placement, geography, device, traffic source, industry, viewer intent, and video type can confound results. The Wistia benchmark sheet does not publish its exact sample or date.
These figures are suitable as source-specific reference points. They are not a universal standard and cannot predict the performance of a new video.
11
References and citation
Cite this research
Recommended citation (APA)
Chen, K. (2026, September 4). Video engagement benchmarks 2026: Eight data points normalized (Version 1.0). TapVid Research. https://tapvid.ai/blog/video-engagement
BibTeX
@techreport{chen2026videoEngagement,
  author = {Kenneth Chen},
  title = {Video Engagement Benchmarks 2026: Eight Data Points Normalized},
  institution = {TapVid Research},
  year = {2026},
  month = {September},
  url = {https://tapvid.ai/blog/video-engagement},
  note = {Version 1.0}
}
Data and source register
- TapVid normalized video engagement benchmark dataset (CSV)Checked 2026-09-04
Version 1.0
12
Frequently asked questions
What is a good video engagement rate?
Use a benchmark with the same platform definition, length bucket, placement, and viewer intent. Wistia reports 50% average engagement below one minute, 47% at 1–3 minutes, 46% at 3–5 minutes, 38% at 5–30 minutes, 26% at 30–60 minutes, and 16% above 60 minutes. Those are Wistia-specific watch-time-share benchmarks, not universal completion rates.
Is video engagement rate the same as completion rate?
No. Average engagement usually measures the share of available watch time consumed. Completion rate measures the share of a denominator that reached the end, but the denominator can be starts, plays, views, or impressions.
Are shorter videos always better?
No. Short videos usually retain a higher percentage of runtime, while longer videos can produce more minutes watched and support deeper tasks. Match length to the viewer's information job.
Can these benchmarks prove a video caused conversions?
No. They describe consumption. Causal conversion impact requires an experiment or a defensible attribution design with a stable offer and comparable audiences.