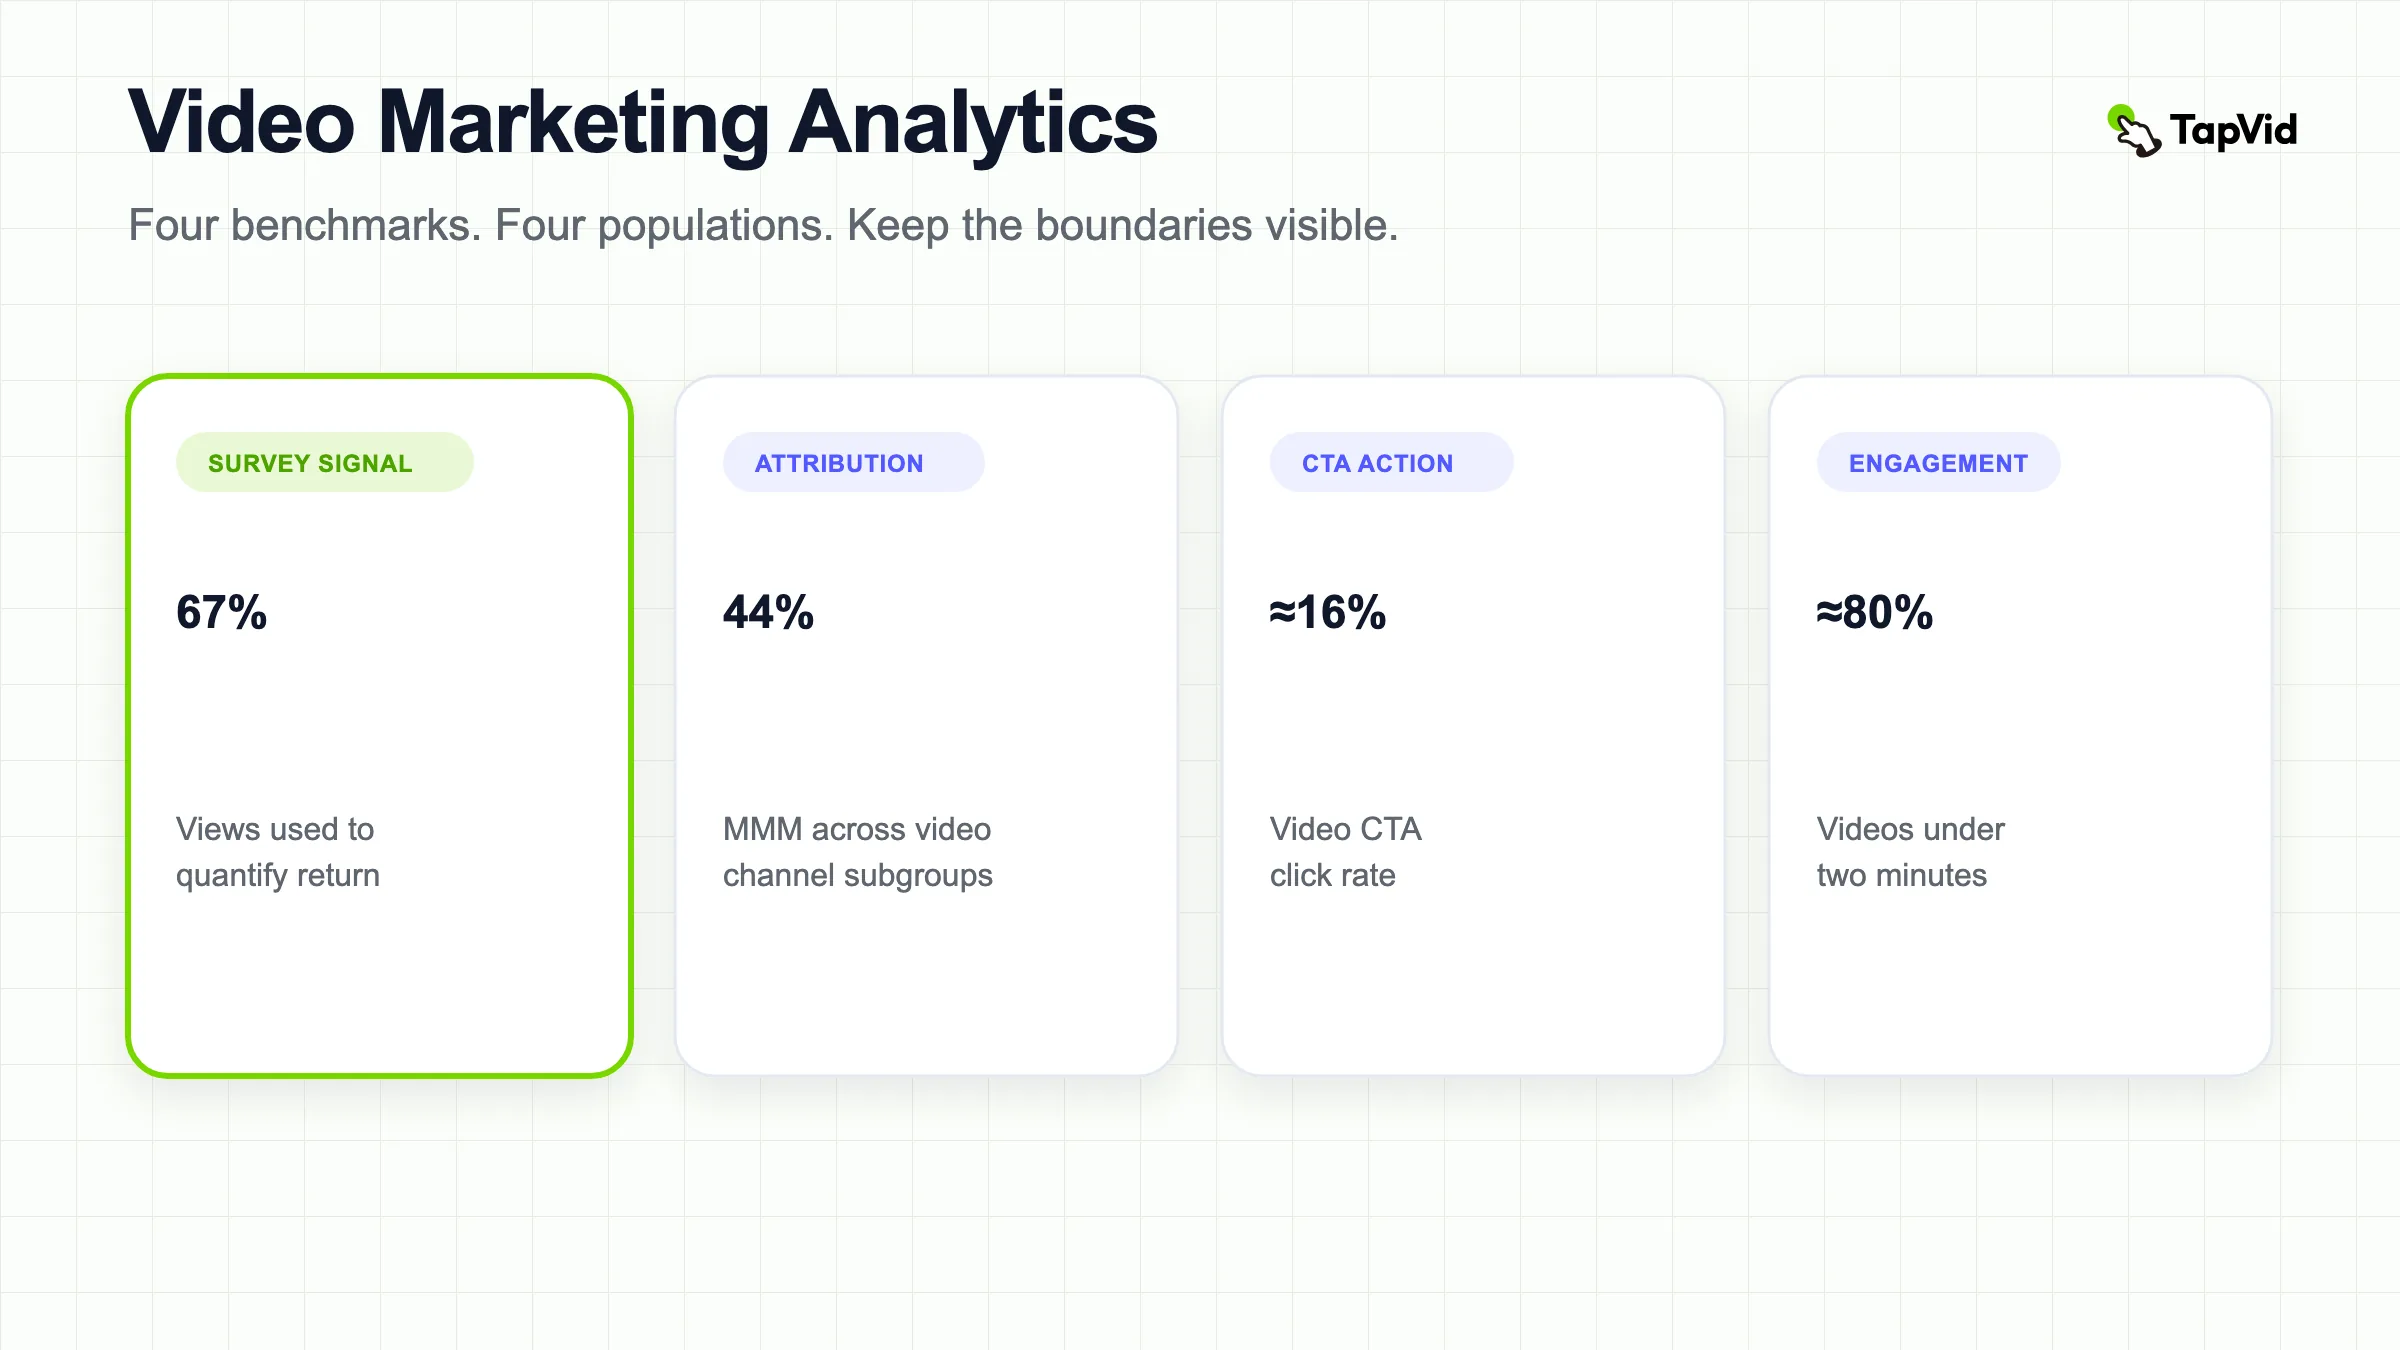

Across CTV, social-video, and online-video advertiser subgroups, the average likelihood of naming marketing mix modeling as a primary business-outcome source was 44%; this video marketing analytics guide treats that result as adjacent attribution evidence, not a universal method benchmark (IAB). TwentyThree reported about 80% average engagement for videos under two minutes within a platform dataset covering more than 2 million videos overall (TwentyThree). Wistia reported about a 16% CTA click rate across more than 36,000 CTAs, illustrating why an event label and exposed population must travel with the number (Wistia). This article aggregates original marketer surveys, paid-video research, and platform telemetry while keeping each source's sample, period, denominator, and limitation visible. Readers will learn how to select metrics, define events and denominators, specify attribution windows, plan instrumentation, and interpret engagement and platform telemetry without turning adjacent evidence into universal targets. Related Research - TapVid video statistics research hub - Video marketing ROI evidence - Explainer conversion benchmark audit
01
Related Research
02
Key Takeaways
- 67% of surveyed video marketers said they quantify video return through views, compared with 32% through bottom-line sales; the marketer subgroup size and geography were not disclosed (Wyzowl).
- 52% of surveyed video marketers used leads or clicks, but the source groups two different events and does not connect either one to incremental revenue (Wyzowl).
- Across CTV, social-video, and online-video advertiser subgroups, the average likelihood of naming marketing mix modeling as a primary business-outcome source was 44%; the overall U.S. buyer survey had 368 respondents, but page 23 does not disclose the three channel-subgroup bases (IAB).
- 52% of surveyed senior marketers reported a lack of unified cross-platform measurement, but this adjacent paid-video study did not disclose its geography or fieldwork dates (Teads and MMA Global).
- Video calls to action averaged about a 16% click rate across more than 36,000 Wistia CTAs, which is a platform action rate, not a purchase conversion rate (Wistia).
- Wistia reported that one in five viewers shown an in-video lead form completed it, but the form-exposure count, geography, and data period were not disclosed (Wistia).
- TwentyThree reported about 80% average engagement for videos under two minutes and about 35% for videos longer than 45 minutes, based on a platform dataset of more than 2 million videos with bucket counts undisclosed (TwentyThree).
- Vidyard reported that 65% of viewers stayed engaged through the end of videos under one minute, versus 20% for videos over 20 minutes, but its sales-video workflow and undefined engagement measure prevent a direct comparison with TwentyThree (Vidyard).
03
How to Define Metrics in Video Marketing Analytics
The first question is not whether a number is high. It is what the number actually represents. A view rate describes media delivery or attention, a CTA click describes an interaction, a form fill describes data submission, and attributed sales describe an outcome under a specific matching or modeling rule. Calling all of them conversion or ROI hides the handoff where measurement often breaks.
This roundup uses four evidence labels. Direct survey evidence reports how active video marketers measure their programs. Direct platform benchmarks summarize behavior observed within a video platform. Adjacent paid-video evidence comes from advertising buyers or CTV and omnichannel-video research. Adjacent sales-video evidence comes from a sales-oriented hosting workflow. Adjacent does not mean irrelevant; it means the population or use case is not the same as a general active video-marketing program.
| Evidence label | What is observed | Legitimate use | Main boundary |
|---|---|---|---|
| Direct survey evidence | Marketers' reported measurement practices | Audit which signals a team calls return | Self-report; subgroup sizes or geography may be undisclosed (Wyzowl) |
| Direct platform benchmark | Viewer actions inside a host's customer base | Compare like-for-like events within the same platform and setup | Customer, upload, placement, and viewer selection (Wistia) |
| Adjacent paid-video evidence | Methods and gaps reported by large video-ad buyers | Design an attribution or incrementality roadmap | Paid media, high-spend buyers, and platform-specific reporting (IAB) |
| Adjacent sales-video evidence | Completion behavior in a sales-video platform | Form a hypothesis for a similar sales workflow | Sales context and an unpublished engagement definition (Vidyard) |
The safest comparison is longitudinal: use the same event definition and denominator for your own videos, then compare against your previous period or a predeclared control. A cross-platform comparison is defensible only when the platforms define the event, exposure, and completion rules the same way. None of the platform reports here provides enough information to establish that equivalence.
04
Metric Selection: What Marketers Count as Video Return
Wyzowl's direct survey is useful as a metric-selection vocabulary audit because it exposes the variety hidden inside the word ROI. The online survey included 266 unique respondents across marketer and consumer routes, was fielded in late 2025, and does not disclose the video-marketer subgroup size or geography (Wyzowl). The response pattern indicates that respondents could select multiple measures, so these percentages should not be added into a single funnel or read as reported financial return.
These percentages describe which signals marketers report using. They do not turn views, engagement, clicks, and sales into one financial-return funnel.
| Reported way to quantify video return | Share | What must be added before business interpretation | Source |
|---|---|---|---|
| Video views | 67% | Qualified reach, view definition, and downstream outcome | Wyzowl |
| Likes, shares, and reposts | 63% | Platform-normalized event rules and connection to an outcome | Wyzowl |
| Leads or clicks | 52% | Separate event counts, lead qualification, and deduplication | Wyzowl |
| Customer engagement and retention | 40% | A retention window, baseline cohort, and separate definitions | Wyzowl |
| Brand awareness or PR | 36% | Baseline, exposed comparison, and defined lift method | Wyzowl |
| Bottom-line sales | 32% | Attribution window, incrementality, margin, and total cost | Wyzowl |
The result is a vocabulary audit, not a hierarchy of metric quality. Views and interactions can be leading indicators for an awareness or education goal. They become misleading when a dashboard relabels them as profit or when a team compares a broad view denominator with a narrow group of form-exposed viewers.
A practical metric tree starts with the program's job. For a product explanation, teams can track eligible page sessions, video starts, qualified watch behavior, a declared next action, accepted leads, and eventual revenue as separate stages. This guide to video marketing examples can help match the measurement plan to a specific use case before choosing a headline metric.
05
Paid-Video Measurement Stacks Are Adjacent Evidence
Two paid-video studies show why attribution rarely comes from a single dashboard. IAB surveyed 368 U.S. agency and brand decision-makers involved in digital-video decisions from February 17 to March 7, 2025; respondents represented organizations with at least $1 million in total 2024 advertising spend (IAB). The sample was 60% agency and 40% brand, so it describes a professional high-spend buying population, not a typical organic program or small business (IAB).
| Primary source used to measure business outcomes | Average likelihood across CTV, social-video, and online-video advertiser subgroups | Interpretation | Source |
|---|---|---|---|
| Marketing mix modeling | 44% | Modeled aggregate contribution; specification and validation not disclosed | IAB |
| Sell-side platform reporting | 42% | Convenient platform-defined outcomes, not independent verification | IAB |
| Internal or first-party analytics | 38% | Organization-owned signals; systems and identity joins not specified | IAB |
| Third-party measurement providers | 37% | External measurement, with provider type and scope undisclosed | IAB |
| Internal business KPIs or sales data | 31% | Outcome data that still requires attribution or an experimental design | IAB |
| Multi-touch attribution | 30% | User-level allocation whose identity coverage and window are undisclosed | IAB |
These reported cross-channel averages describe source use, not accuracy or a simple share of all 368 respondents (IAB). A team can use sales data and still misattribute sales. It can use a model and still choose the wrong lag structure. It can also reconcile platform reporting with first-party events without proving that the campaign caused the observed difference.
The adjacent label is especially important for organic and owned video. Paid-video buyers can rely on impression logs, spend variation, platform experiments, and modeled reach that may not exist in an owned-content program. The right lesson is to combine independent outcome data with a declared causal method, not to copy the adoption percentages as a maturity score.
06
Video Attribution Methods and Measurement Gaps
The Teads and MMA Global study adds senior marketers' stated gaps and methods. It surveyed 102 senior marketers, but the public report does not disclose geography or fieldwork dates; it is sponsored or co-published paid-video research rather than neutral telemetry (Teads and MMA Global). Its numbers are adjacent to an active video-marketing program and should be used as diagnostic prompts.
| Paid-video measurement finding | Share | Evidence boundary | Source |
|---|---|---|---|
| Use incrementality testing | 59% | Reported use does not reveal randomization, holdout quality, or power | Teads and MMA Global |
| Lack unified measurement across platforms | 52% | Perceived top challenge; geography and fieldwork undisclosed | Teads and MMA Global |
| Use marketing mix modeling | 52% | Model specification, refresh cadence, and validation are not reported | Teads and MMA Global |
| Gap linking exposure to business outcomes | 48% | Perceived gap, not an observed error rate | Teads and MMA Global |
| Use multi-touch attribution | 43% | Identity resolution, attribution window, and validation are undisclosed | Teads and MMA Global |
| Difficulty integrating data across formats | 40% | Paid-video context and respondent-defined difficulty | Teads and MMA Global |
Incrementality, MMM, and MTA answer different questions. A controlled holdout estimates what happened because exposure changed for comparable groups. Marketing mix modeling estimates aggregate contribution from time-series variation and assumptions. Multi-touch attribution allocates credit among recorded contacts. None can replace missing event governance, and reported use does not establish that a method was implemented well.
For an active program, document the attribution window before launch, preserve raw event timestamps, deduplicate users where consent and policy allow, and keep platform-reported and first-party outcomes in separate columns. If the two disagree, investigate definitions before choosing the larger value. The measurement gap itself is information: it shows where a decision should remain uncertain.
07
Platform Engagement Benchmarks Are Not Interchangeable
TwentyThree and Vidyard both publish duration-based behavior, but they use different products, customer mixes, workflows, and labels. TwentyThree's State of Video report covers more than 2 million platform videos and reports average engagement by duration bucket; exact time period, geography, and bucket-level play counts are not disclosed (TwentyThree). Vidyard analyzed more than 940,000 customer videos from January 1 to December 15, 2024 in a sales-oriented workflow, but does not publish viewer counts or define “stayed engaged” on the benchmark page (Vidyard).
Platform Engagement Benchmarks Are Not Interchangeable · Evidence chart
Open any row for its source, sample, evidence class, and limitation. Each panel uses its own declared scale.
TwentyThree
TwentyThree videos under two minutes≈80%
- Source
- TwentyThree
- Year
- 2024
- Sample
- More than 2 million videos overall; duration-bucket play count undisclosed
- Evidence class
- Platform benchmark
- Limitation
- More than 2 million videos overall; duration-bucket play count undisclosed
TwentyThree videos from two to five minutes≈55%
- Source
- TwentyThree
- Year
- 2024
- Sample
- Rounded platform estimate; content mix and bucket count undisclosed
- Evidence class
- Platform benchmark
- Limitation
- Rounded platform estimate; content mix and bucket count undisclosed
TwentyThree videos from five to 15 minutes≈50%
- Source
- TwentyThree
- Year
- 2024
- Sample
- Intent and format mix uncontrolled
- Evidence class
- Platform benchmark
- Limitation
- Intent and format mix uncontrolled
TwentyThree videos from 15 to 45 minutes≈45%
- Source
- TwentyThree
- Year
- 2024
- Sample
- Long-form audience intent may differ from a typical program
- Evidence class
- Platform benchmark
- Limitation
- Long-form audience intent may differ from a typical program
TwentyThree videos longer than 45 minutes≈35%
- Source
- TwentyThree
- Year
- 2024
- Sample
- Repeat viewing, intent, and bucket count undisclosed
- Evidence class
- Platform benchmark
- Limitation
- Repeat viewing, intent, and bucket count undisclosed
Vidyard
Vidyard videos under one minute65%
- Source
- Vidyard
- Year
- 2025
- Sample
- More than 940,000 videos overall; viewer count and definition undisclosed
- Evidence class
- Platform benchmark
- Limitation
- More than 940,000 videos overall; viewer count and definition undisclosed
Vidyard videos over 20 minutes20%
- Source
- Vidyard
- Year
- 2025
- Sample
- Sales-workflow selection; not definitionally comparable with TwentyThree
- Evidence class
- Platform benchmark
- Limitation
- Sales-workflow selection; not definitionally comparable with TwentyThree
The within-platform direction is similar, but the percentages are not interchangeable: TwentyThree reports average engagement, while Vidyard reports the share that stayed engaged through the end.
| Platform duration result | Reported value | Denominator and limitation | Source |
|---|---|---|---|
| TwentyThree videos under two minutes | About 80% average engagement | More than 2 million videos overall; duration-bucket play count undisclosed | TwentyThree |
| TwentyThree videos from two to five minutes | About 55% average engagement | Rounded platform estimate; content mix and bucket count undisclosed | TwentyThree |
| TwentyThree videos from five to 15 minutes | About 50% average engagement | Intent and format mix uncontrolled | TwentyThree |
| TwentyThree videos from 15 to 45 minutes | About 45% average engagement | Long-form audience intent may differ from a typical program | TwentyThree |
| TwentyThree videos longer than 45 minutes | About 35% average engagement | Repeat viewing, intent, and bucket count undisclosed | TwentyThree |
| Vidyard videos under one minute | 65% stayed engaged through the end | More than 940,000 videos overall; viewer count and definition undisclosed | Vidyard |
| Vidyard videos over 20 minutes | 20% stayed engaged through the end | Sales-workflow selection; not definitionally comparable with TwentyThree | Vidyard |
The rows suggest a within-platform duration pattern, not a universal ideal length. Short videos have less elapsed time in which a viewer can leave, while long videos often serve a different task and audience. Average percentage watched can also reward short duration even when a longer video produces more total watch time or better-qualified actions.
Use each report as a hypothesis generator. In your program, group videos by comparable job, traffic source, placement, and audience temperature before evaluating duration. A feature walkthrough, social clip, webinar, and sales follow-up should not share one completion target.
08
CTA and Lead-Form Benchmarks Need Exposed-Viewer Denominators
Wistia's CTA and lead-form data are closer to action measurement than broad survey perceptions, but the event definitions remain narrow. Its CTA analysis covers more than 36,000 CTAs in 2024, while the lead-form article does not publish the form-exposure count, geography, or exact data period for its overall and format results (Wistia; Wistia). The denominator is viewers exposed to the interactive element, not everyone reached by the program.
| Wistia platform benchmark | Reported value | What the event does not establish | Source |
|---|---|---|---|
| Average video CTA conversion | About 16% | A CTA conversion is a click, not a purchase or qualified lead | Wistia |
| Average in-video lead-form completion | One in five | Form submission does not establish lead acceptance, sale, or profit | Wistia |
| Original-series video lead-form completion | 30% | Format subset size, placement, and lead quality are undisclosed | Wistia |
| On-demand webinar lead-form completion | 25% | Gated high-intent viewer selection limits generalization | Wistia |
| Sales-video lead-form completion | 20% | Consideration-stage audience and subset size are undisclosed | Wistia |
| Testimonial and product-explainer lead-form completion | 17% | Two formats share one rate; subgroup size and lead quality are undisclosed | Wistia |
TwentyThree separately reports a 26% lead-conversion rate for forms shown before playback, within its dataset of more than 2 million platform videos; the form-exposure count, fields, data period, and qualified-lead rate are not disclosed (TwentyThree). That result cannot be ranked against Wistia's figures without equivalent placement and exposure rules. A pre-video gate can increase the form rate among people who proceed while suppressing total plays, a tradeoff hidden by a single percentage.
Record at least three counts: eligible page visitors, viewers actually shown the element, and successful submissions. Then carry accepted leads, opportunities, and revenue as later events rather than silently redefining a form fill as conversion. Creative context can inform the test, but any performance claim still needs the team's own denominator and outcome chain.
09
Build an Instrumentation Plan Before Comparing Results
A defensible scorecard begins before distribution. Define the business question, eligible population, exposure rule, primary outcome, guardrail metrics, window, and comparison design. Preserve versions of the script, source assets, placement, CTA, audience, and media settings so that a result is not attributed to the wrong change.
| Planning field | Minimum record | Why it matters | Failure signal |
|---|---|---|---|
| Program job | One audience, one use case, one decision | Prevents a mixed-purpose average | Awareness and sales metrics are presented as substitutes |
| Exposure | Exact rule for start, impression, or element shown | Establishes the denominator | “Conversion” has no exposed population |
| Outcome | Named event plus acceptance rule | Separates click, form fill, lead, sale, and profit | One label covers several funnel stages |
| Window | Observation and attribution periods | Controls delayed outcomes and repeat contact | Each platform applies its own default |
| Comparison | Prior baseline, matched cohort, or holdout | Distinguishes change from background variation | A post-launch increase is treated as causation |
| Creative version | Script, assets, scene mapping, CTA, and placement | Limits uncontrolled differences | Several inputs change between variants |
For a small business or SaaS team measuring a product-explanation program, creative consistency is part of measurement hygiene. TapVid's formal product category is an Explainer Video Engine: the workflow is designed to turn supplied product assets and a supplied script into a deliverable video while preserving asset fidelity, literal information, and product-to-scene correspondence. That accuracy boundary can make versions easier to inspect; it does not prove that TapVid caused a change in conversion, revenue, or ROI. Teams can use the AI Explainer Video Generator workflow, predeclare the outcome, and judge the resulting video against their own baseline.
The final operating rule is simple: compare like with like, and keep unknowns visible. A platform benchmark can set an investigation range, but only your stable event definitions and controlled comparisons can establish whether the active program improved.
10
Video Marketing Analytics by the Numbers
This summary selects citation-ready figures across direct and adjacent evidence. The evidence label and denominator are part of each statistic, not optional footnotes.
| Metric | Value | Evidence scope and denominator | Source |
|---|---|---|---|
| Video marketers quantifying return with views | 67% | Direct survey; video-marketer subgroup n undisclosed | Wyzowl |
| Video marketers quantifying return with engagement | 63% | Direct survey; likes, shares, and reposts | Wyzowl |
| Video marketers quantifying return with leads or clicks | 52% | Direct survey; two events combined | Wyzowl |
| Video marketers quantifying return with bottom-line sales | 32% | Direct survey; attribution and margin rules undisclosed | Wyzowl |
| Average likelihood of naming MMM across CTV, social-video, and online-video advertiser subgroups | 44% | Adjacent paid video; overall survey n=368, channel-subgroup bases undisclosed | IAB |
| Average likelihood of naming platform reporting across the same advertiser subgroups | 42% | Adjacent paid video; overall survey n=368, channel-subgroup bases undisclosed | IAB |
| Senior marketers reporting no unified cross-platform measurement | 52% | Adjacent paid video; n=102, geography undisclosed | Teads and MMA Global |
| Senior marketers using incrementality testing | 59% | Adjacent paid video; reported use, quality undisclosed | Teads and MMA Global |
| Senior marketers reporting an exposure-to-outcome gap | 48% | Adjacent paid video; perceived gap, not error rate | Teads and MMA Global |
| Average Wistia CTA click rate | About 16% | Direct platform; more than 36,000 CTAs | Wistia |
| Average Wistia in-video lead-form completion | One in five | Direct platform; exposed-viewer count undisclosed | Wistia |
| Wistia product-explainer and testimonial form completion | 17% | Direct platform; combined subset n undisclosed | Wistia |
| TwentyThree engagement for videos under two minutes | About 80% | Direct platform; more than 2 million videos overall | TwentyThree |
| TwentyThree engagement for videos longer than 45 minutes | About 35% | Direct platform; duration-bucket count undisclosed | TwentyThree |
| TwentyThree pre-video form lead conversion | 26% | Direct platform; form-exposure count undisclosed | TwentyThree |
| Vidyard completion for videos under one minute | 65% | Adjacent sales video; more than 940,000 videos overall | Vidyard |
| Vidyard completion for videos over 20 minutes | 20% | Adjacent sales video; viewer count and definition undisclosed | Vidyard |
11