
There is no credible single current or US-wide average for explainer video conversion rate benchmarks. The strongest recent causal result in this audit is a randomized shoppable-product-video test in which conversion rose from 3.96% to 5.75%, while the exact explainer-video test most often cited is from 2011 and does not disclose its sample size or statistical significance (Whatmore; Unbounce). A separate landing-page test found that adding video reduced email acquisition from 28.6% to 24.0%, showing why positive cases cannot be treated as a default (NextAfter). This audit organizes exact and adjacent conversion tests, negative and null findings, and purchase-intent studies, with every geography and denominator stated. You will learn which results support causal conversion claims, which findings set boundaries, and which measure purchase intent rather than observed sales. Related Research - TapVid video statistics research hub - Video marketing ROI evidence - Video marketing analytics measurement guide
01
Related Research
02
Key Takeaways
- No source in this audit establishes a current US-wide average explainer-video conversion rate. The exact explainer test is a 2011 email-signup case with no reported sample size or significance (Unbounce).
- A randomized 2026 shoppable-product-video test reported a 45.1% relative lift, from 3.96% to 5.75%, across 50,476 visitors to 135 apparel product pages (Whatmore).
- Video did not always help landing pages. A 2024 Hoover Institution test reported a 15.9% relative decline in email acquisition, from 28.6% to 24.0%, at 99.5% confidence (NextAfter).
- Revenue and form conversion can move in different directions. A separate Hoover test found a non-valid 5.2% revenue-per-visitor increase but an 18.2% decrease in email acquisitions at 98% confidence (NextAfter).
- Watching is not the same as being caused to convert. Whatmore observed 13.85% conversion among watchers versus 4.96% among non-watchers, but explicitly identified self-selection as a reason not to call that 2.8x ratio causal (Whatmore).
- Self-reported influence is not observed conversion. In Wyzowl's 2026 survey, 85% of consumer respondents said a video had convinced them to buy, but the consumer subgroup size and geography were not disclosed (Wyzowl).
- Usage-focused product video beat appearance-only video in two China-indicated experiments, with purchase-intent means of 5.43 versus 4.49 for electric kettles and 5.84 versus 4.43 for canvas shoes on a seven-point scale; respondent location was not explicitly reported (Frontiers in Psychology).
- The control, conversion event, population, and geography define the benchmark. Wyzowl's survey responses and academic purchase-intent scores cannot be averaged with observed page conversion or treated as causal lift (Wyzowl; Frontiers in Psychology).
03
What Exact Explainer Video Conversion Rate Benchmarks Show
The evidence gap is the central finding. One traceable experiment directly compared animated explainer treatments with a no-video control, but it is old and methodologically incomplete. For a plain-language definition of the format before interpreting the test, see what an explainer video is.
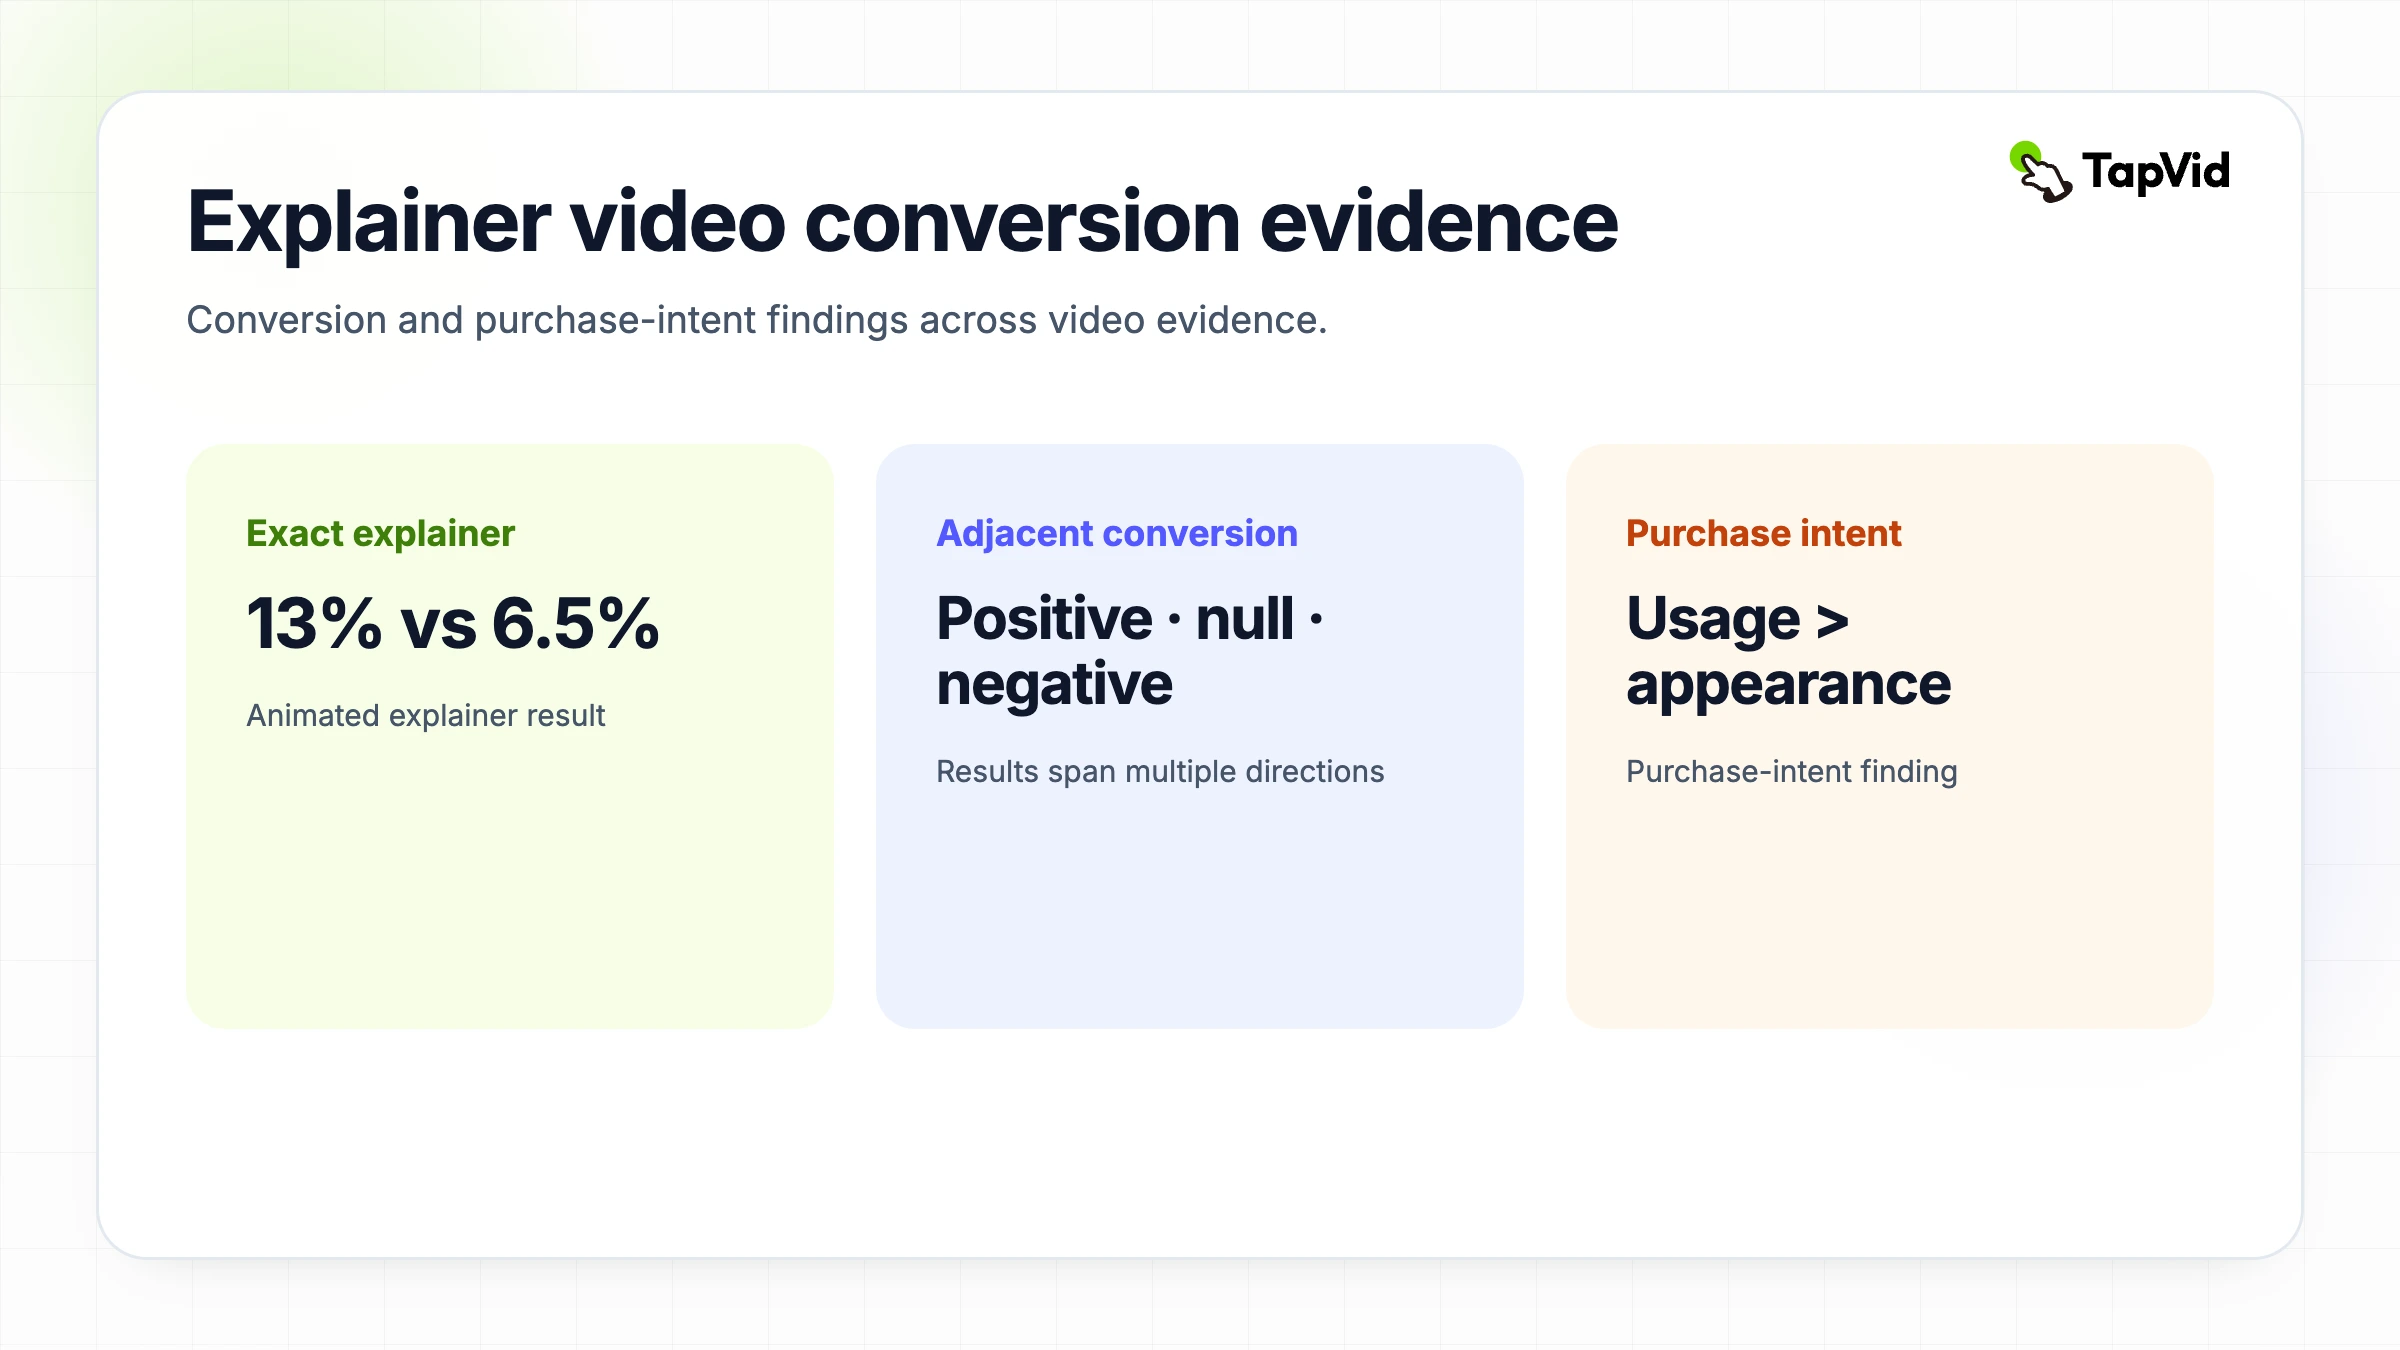
The lightbox animated-explainer variant converted 13% of visitors, versus 6.5% for no video, but the source did not report traffic counts or significance. (Unbounce)
What Exact Explainer Video Conversion Rate Benchmarks Show · Evidence chart
Open any row for its source, sample, evidence class, and limitation. Each panel uses its own declared scale.
Unbounce · 2011
Whatmore · 2026
NextAfter · 2024
Control · Source
- Source
- NextAfter
- Year
- 2024
- Sample
- US institution; visitor geography unstated; 2,934 visitors
- Evidence class
- Controlled experiment
- Limitation
- US institution; visitor geography unstated; 2,934 visitors
Video treatment · Source
- Source
- NextAfter
- Year
- 2024
- Sample
- US institution; visitor geography unstated; 2,934 visitors
- Evidence class
- Controlled experiment
- Limitation
- US institution; visitor geography unstated; 2,934 visitors
The direction depends on the page and conversion event: an old exact-explainer case reported gains without sample disclosure, a 50,476-visitor product-video experiment increased product-page conversion, and a 2,934-visitor landing-page test reduced email acquisition (Unbounce; Whatmore; NextAfter).
| Exact explainer evidence | Value | Geography | Source |
|---|---|---|---|
| No-video email-signup control | 6.5% | Not reported | Vidyard / Unbounce, 2011 |
| Inline animated explainer | 11%, reported 69% lift | Not reported | Vidyard / Unbounce, 2011 |
| Lightbox animated explainer | 13%, reported 100% lift | Not reported | Vidyard / Unbounce, 2011 |
| Sample and significance disclosure | Not reported | Not reported | Vidyard / Unbounce, 2011 |
The experiment duration was not disclosed. The author described spending six months investigating video's impact, but that statement does not establish a six-month test period (Unbounce). The page was Vidyard's pre-launch email-signup page, not an ecommerce checkout or completed sale. The lightbox treatment also changed placement and interaction, so its result cannot isolate the effect of video presence. It is useful historical evidence, not a 2026 norm.
04
Randomized Product and Shoppable Video Conversion Evidence
Randomized test metric
3.96%
Control conversion rate
24,777 visitors
Whatmore, 2026Checked 2026-08-17
5.75%
Video-treatment conversion rate
25,699 visitors
Whatmore, 2026Checked 2026-08-17
45.1%
Reported relative lift
50,476 randomized visitors
Whatmore, 2026Checked 2026-08-17
1.79 percentage points
Absolute conversion difference
50,476 randomized visitors
Whatmore, 2026Checked 2026-08-17
The best powered causal evidence in the dataset is adjacent to explainer video rather than exact. Whatmore randomized visitors to a floating shoppable-video widget or no widget across one anonymized apparel brand. The report uses INR-denominated order values, which strongly indicates India, but it does not explicitly state the visitor or brand geography.
The treatment converted 5.75% of visitors, compared with 3.96% for control, a reported 45.1% relative lift and 1.79 percentage-point absolute gain. (Whatmore)
| Randomized test metric | Value | Denominator | Source |
|---|---|---|---|
| Widget exposure vs any video watched | 88.3% shown; 8.9% watched | 22,698 shown and 2,289 watched, each out of 25,699 treatment visitors | Whatmore, 2026 |
| Watchers versus non-watchers | 13.85% vs 4.96% | 2,289 vs 23,410 treatment visitors | Whatmore, 2026 |
| Highest watch-depth group | 17.2% conversion | 710 visitors watching 75% to 100% | Whatmore, 2026 |
The randomized arm comparison supports causality for the widget treatment. The watcher comparison does not, because people chose whether to watch. Teams designing their own experiment should align the message, page intent, and conversion event before traffic is split.
05
Landing Page Video Tests Include Positive, Negative, and Null Results
Landing-page evidence does not point in one direction. The experiments differ in audience, offer, traffic volume, conversion action, and treatment design. This is why a large lift from a small case and a significant decline from a larger test should be reported side by side, not averaged.
The strongest disclosed landing-page counterexample is a 2,934-visitor Hoover test in which video reduced email acquisition by 15.9% at 99.5% confidence. (NextAfter)
| Landing-page outcome | Result | Geography and sample | Source |
|---|---|---|---|
| Hoover email acquisition | 28.6% control vs 24.0% video, down 15.9% | US institution; visitor geography unstated; 2,934 visitors | NextAfter, 2024 |
| Hoover power check | 2,934 observed vs 718 required | US institution; visitor geography unstated | NextAfter, 2024 |
| Hoover revenue per visitor | $0.57 control vs $0.60 video, up 5.2% at 52.8% confidence | US institution; sample and visitor geography unstated | NextAfter, 2024 |
| Hoover email acquisition in the revenue test | Down 18.2% at 98% confidence | US institution; sample and visitor geography unstated | NextAfter, 2024 |
| Brafton client goal completion | Just over 7% text vs over 25% video, reported 257% lift | Geography unstated; 42 control visits and over 100 video visits | Brafton, 2013 |
Named outcomes are grouped by direction only. Conversion, email acquisition, revenue per visitor, purchase intent, and perceived information remain separate measures rather than one pooled benchmark.
The revenue test is especially useful because its outcomes conflict. Email acquisition fell significantly, while revenue per visitor increased by a statistically invalid amount. A team optimizing for leads would reach a different decision from a team optimizing for immediate revenue, even on the same page.
Brafton's two-week case is directionally positive but fragile: the client, geography, conversion action, exact treatment traffic, and video type were not disclosed (Brafton). Its 257% headline belongs in a case-study column, not a general benchmark.
06
Explainer Exposure and Purchase Influence Stay Self-Reported
Survey measure
96% of consumer respondents
Watched an explainer to learn
Exposure and learning recall
Wyzowl, 2026Checked 2026-08-17
85% of consumer respondents
Video convinced a purchase
Self-reported persuasion
Wyzowl, 2026Checked 2026-08-17
80% of consumer respondents
Bought or downloaded an app after a demo
Self-reported action after app-demo video
Wyzowl, 2026Checked 2026-08-17
68% of video marketers
Created explainer videos
Format adoption
Wyzowl, 2026Checked 2026-08-17
Survey data shows how common explainers are and how consumers remember video affecting them. It does not observe a controlled conversion event. Wyzowl's current wave included 266 total respondents across marketer and consumer groups, but it did not disclose subgroup sizes or geography (Wyzowl).
Some 96% of consumer respondents said they had watched an explainer video to learn about a product or service. (Wyzowl)
A survey can justify hypotheses about explainer exposure and purchase influence. It cannot replace an experiment on a specific page.
07
Product Video Purchase Intent Shows Content and Trust Effects
Purchase-intent mechanisms, not conversion rates
beta=0.676; p<0.001
Perceived information to purchase intent
China; 124 valid datasets
Future Internet, 2019Checked 2026-08-17
beta=0.214; p<0.001
Mental imagery to purchase intent
Southern China; 406 participants
Behavioral Sciences, 2024Checked 2026-08-17
beta=0.397; p<0.001
Solution innovativeness to purchase intent
Southern China; 406 participants
Behavioral Sciences, 2024Checked 2026-08-17
Academic studies add controlled evidence about video content, but their outcomes are mostly stated purchase intention on a seven-point scale. The Frontiers experiments are China-indicated, but respondent location was not explicitly reported; their demographic tables list predominantly undergraduate/postgraduate education categories, which do not establish that respondents were current students. Other retained academic studies report China or Southern China populations. None measures a US conversion rate.
Usage-focused videos produced higher purchase-intent scores than appearance-focused videos for both an electric kettle and canvas shoes, but the advantage disappeared under a low product rating. (Frontiers in Psychology)
Controlled content and format comparisons
| Product-video comparison | Result | Geography and sample | Source |
|---|---|---|---|
| Electric kettle, usage vs appearance video | 5.43 vs 4.49; p<0.01 | China-indicated; respondent location not explicitly reported; 144 completed | Frontiers in Psychology, 2022 |
| Canvas shoes, usage vs appearance video | 5.84 vs 4.43; p<0.01 | China-indicated; respondent location not explicitly reported; 188 completed | Frontiers in Psychology, 2022 |
| High-rating shoes, usage vs appearance | 5.61 vs 4.52; p<0.01 | China-indicated; respondent location not explicitly reported; about 94 observations implied by df | Frontiers in Psychology, 2022 |
| Low-rating shoes, usage vs appearance | 3.25 vs 3.16; p>0.1, not significant | China-indicated; respondent location not explicitly reported; about 95 observations implied by df | Frontiers in Psychology, 2022 |
| Video review vs text review | 4.6907 vs 3.6902; p<0.001 | China; 354 university participants | Journal of Global Information Management, 2021 |
| Video review vs image review | 4.6907 vs 4.3181; p<0.05 | China; 354 university participants | Journal of Global Information Management, 2021 |
| Smartphone video with vs without usage scenario | Perceived information 4.42 vs 2.80; p<0.001 | China; 124 valid datasets across study | Future Internet, 2019 |
| Juice-extractor video with vs without tutorial | Perceived information 4.522 vs 4.524; p=0.927 | China; 124 valid datasets across study | Future Internet, 2019 |
The low-rating and tutorial nulls matter. More demonstration detail did not overcome a weak rating, and adding tutorial information did not increase perceived information for the juice extractor. Before testing production styles, hold the factual message constant across variants.
Purchase-intent mechanisms, not conversion rates
These coefficients describe relationships among survey constructs. They must not be translated into percentage conversion lifts. They are most useful for deciding what intermediate measures to collect, such as information uptake and mental imagery, before the final behavioral outcome.
08
How to Read This Explainer Conversion Evidence Audit
The locked dataset contains 27 atomic records, but they are not independent studies. Multiple records intentionally preserve different arms, outcomes, and denominators from the same source group, including Whatmore, Wyzowl, and Frontiers in Psychology. Counting atoms makes the audit transparent; counting them as separate corroborations would overstate the evidence.
| Evidence family | Valid interpretation | Invalid interpretation | Main limitation |
|---|---|---|---|
| Randomized conversion lift | Incremental effect of the tested treatment on the defined event | Average explainer-video lift | One apparel brand; geography not explicit |
| Landing-page conversion | Effect on the page's named action | Purchase conversion if the action was email signup | Offers, audiences, and samples differ |
| Self-reported persuasion | What respondents remember or believe | Observed causal purchases | Subgroup sizes and geography may be missing |
| Purchase-intent score | Controlled attitudinal response | Real checkout conversion | Scenario studies, mainly China samples |
| Revenue per visitor | Financial outcome for the tested page | Valid lift without sufficient confidence | Can diverge from form conversion |
Publication date and data period were kept separate. Unknown dates remain unknown rather than being assigned a fabricated day. All retained geographies use the recorded categories “China,” “Southern China,” “China-indicated; respondent location not explicitly reported,” “India-indicated but unstated,” “US institution with visitor geography unstated,” or “not reported.”
To create a useful internal benchmark, define one primary conversion event, one guardrail, the eligible visitor population, exposure rules, attribution window, and minimum detectable effect before launch. Report absolute percentage-point change beside relative lift, and keep revenue separate from form completions. If the goal is product explanation or feature introduction, compare the new video treatment with the current page experience, not with an unrelated industry average.
TapVid is an Explainer Video Engine for small and midsize businesses and professional content producers. Its product-explanation workflow starts with accuracy: product images, logos, UI screenshots, and footage remain the supplied assets; wording, numbers, model names, prices, parameters, and legal copy remain verbatim; and each script segment, shot, voiceover, and asset can be checked for the correct product correspondence before rendering. That accuracy-first workflow does not promise a conversion or ROI result. Teams evaluating an AI explainer video generator should still run the controlled measurement plan above on their own page and audience.
09
Explainer Video Conversion Rate Benchmarks by the Numbers
| Metric | Value | Category | Geography | Source |
|---|---|---|---|---|
| Exact animated explainer, inline | 11% vs 6.5% control | Email-signup conversion | Not reported | Unbounce, 2011 |
| Exact animated explainer, lightbox | 13% vs 6.5% control | Email-signup conversion | Not reported | Unbounce, 2011 |
| Randomized shoppable-video treatment | 5.75% vs 3.96% control | Purchase conversion | India indicated; not explicit | Whatmore, 2026 |
| Randomized shoppable-video lift | 45.1% relative; 1.79 percentage points absolute | Experimental lift | India indicated; not explicit | Whatmore, 2026 |
| Watchers vs non-watchers | 13.85% vs 4.96%, non-causal | Observational conversion | India indicated; not explicit | Whatmore, 2026 |
| Hoover email-acquisition test | Down 15.9%, from 28.6% to 24.0% | Landing-page conversion | US institution; visitors unstated | NextAfter, 2024 |
| Hoover revenue per visitor | Up 5.2% at 52.8% confidence, not valid | Financial outcome | US institution; visitors unstated | NextAfter, 2024 |
| Hoover email acquisition in revenue test | Down 18.2% at 98% confidence | Form conversion | US institution; visitors unstated | NextAfter, 2024 |
| Brafton video landing page | Over 25% vs just over 7% | Goal completion | Not reported | Brafton, 2013 |
| Watched an explainer to learn | 96% of consumer respondents | Self-reported exposure | Not reported | Wyzowl, 2026 |
| Video convinced a purchase | 85% of consumer respondents | Self-reported influence | Not reported | Wyzowl, 2026 |
| App demo preceded purchase/download | 80% of consumer respondents | Self-reported action | Not reported | Wyzowl, 2026 |
| Electric-kettle usage vs appearance video | 5.43 vs 4.49 | Purchase intent | China-indicated; respondent location not explicitly reported | Frontiers in Psychology, 2022 |
| Canvas-shoe usage vs appearance video | 5.84 vs 4.43 | Purchase intent | China-indicated; respondent location not explicitly reported | Frontiers in Psychology, 2022 |
| Video review vs text review | 4.6907 vs 3.6902 | Purchase intent | China | JGIM, 2021 |
| Usage scenario in smartphone video | 4.42 vs 2.80 | Perceived information | China | Future Internet, 2019 |
10
Sources
- Whatmore, “Pressure-testing a +45% shoppable video lift,” published May 26, 2026
- Unbounce, “Using Video to Lift Landing Page Conversion Rate by 100%,” published October 31, 2011
- NextAfter, Hoover email-acquisition video experiment, August 12 to August 19, 2024
- NextAfter, Hoover donation-page video experiment, August 12 to August 21, 2024
- Wyzowl, “Video Marketing Statistics 2026,” fieldwork in late 2025
- Brafton, “Proof that landing pages with video provide superior ROI,” published November 25, 2013
- Frontiers in Psychology, “Effect of Product Presentation Videos on Consumers' Purchase Intention,” published February 17, 2022
- Journal of Global Information Management, “The Effects of Review Presentation Formats on Consumers' Purchase Intention,” issue dated January 1, 2021
- Future Internet, “Impacts of Video Display on Purchase Intention for Digital and Home Appliance Products,” published October 24, 2019
- Behavioral Sciences, “Seeing as Feeling? The Impact of Tactile Compensation Videos on Consumer Purchase Intention,” published January 12, 2024