
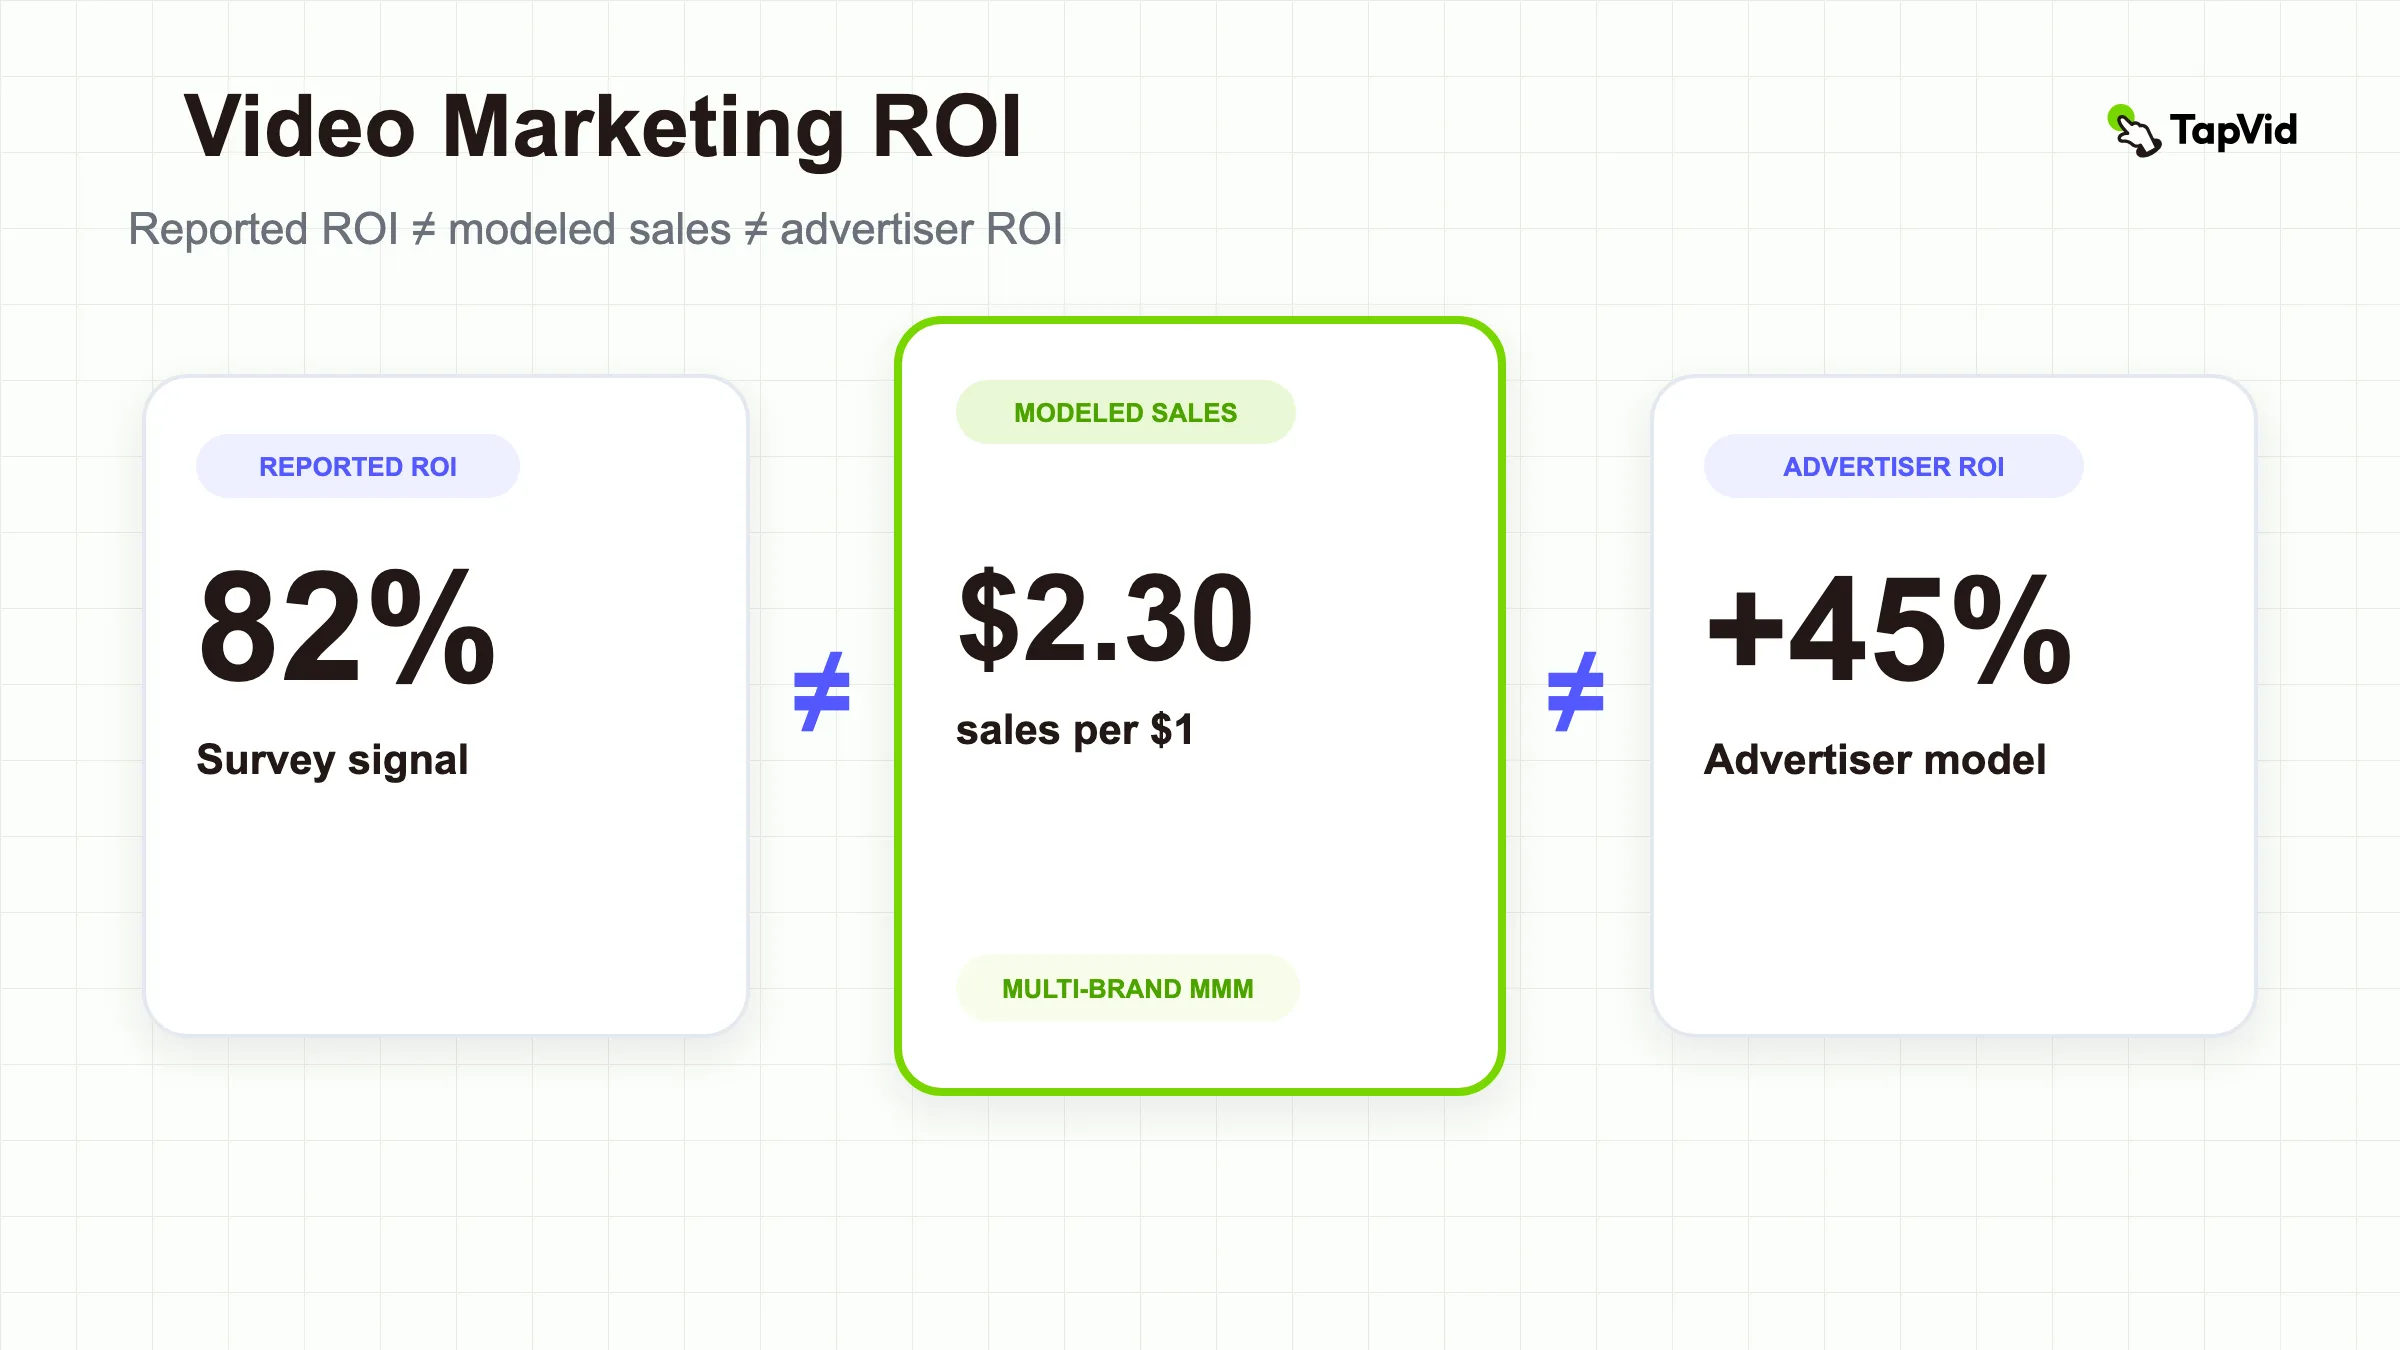

For video marketing ROI, 82% of surveyed video marketers said video marketing had delivered a good return, although the survey did not define a financial threshold for “good” (Wyzowl, Video Marketing Statistics 2026). In the same late-2025 survey, 83% said video had directly increased sales, but that result is self-reported attribution rather than an incrementality test (Wyzowl). A TikTok-commissioned Nielsen model reported $2.30 in short-term and long-term sales per advertising dollar across 10 CPG brands in Indonesia and Thailand, with no public confidence intervals (Nielsen and TikTok). This article aggregates 18 statistics from original surveys, marketing mix models, and test programs, with each result labeled as reported perception, investment intent, modeled sales, purchase intent, or advertiser-specific ROI ([see all original sources](#sources)). Readers can use the evidence to compare reported business return, sales lift, and ROAS without treating any one result as a universal causal benchmark; start with the statistics research hub for the coordinated cluster view.
01
Key Takeaways
- 82% of surveyed video marketers said video marketing had produced a good ROI, based on a routed online survey of 266 marketer and consumer respondents fielded in late 2025; geography, marketer subgroup size, and the financial threshold for “good” were not disclosed (Wyzowl).
- 83% of surveyed video marketers said video had directly increased sales, but the finding reflects marketer attribution and does not establish incremental sales caused by video (Wyzowl).
- 48.6% of more than 1,500 global marketers selected short-form video as a format with the biggest ROI, compared with 28.6% for long-form video and 25.1% for live streaming; these are respondent rankings, not audited dollar returns (HubSpot).
- 58% of 980 B2B content marketers, mostly in North America, said video produced the best results among content types in the prior 12 months; “best results” was respondent-defined and is not the same as financial ROI (Content Marketing Institute and MarketingProfs).
- 37.1% of more than 1,500 global marketers planned to increase video-marketing investment in 2026, which records budget intent rather than realized return (HubSpot).
- 65% of nearly 2,000 global marketers managing budgets of at least $1 million planned to increase online or mobile video spending in 2024, based on a December 2023 survey (Nielsen annual report, PDF page 7).
- TikTok paid ads returned a modeled $2.30 in short-term and long-term sales per advertising dollar across 10 CPG brands in Indonesia and Thailand; the commissioned public study did not disclose the exact campaign count or uncertainty intervals (Nielsen and TikTok).
- Domino's U.K. and Ireland measured a 45% increase in YouTube ROI when brand-awareness and performance campaigns ran concurrently, but this is a one-advertiser media mix model and not a general video benchmark (Domino's, Ebiquity, and Google).
02
Reported Video Marketing ROI and Direct Sales
Reported return is useful evidence of marketer experience, but it is not a standardized financial ratio. The Wyzowl survey routed questions between marketers and consumers and did not publish the marketer subgroup size or geography. Its retained findings answer whether marketers believe video pays back and whether they attribute sales to it. They do not reveal incremental margin, attribution windows, media cost, or production cost.
82% of surveyed video marketers said video marketing had given them a good ROI (Wyzowl). The same survey found 83% said video had directly increased sales (Wyzowl). The wording matters: both values are reported perceptions from one survey, and neither should be rewritten as a measured sales-lift estimate.
| Reported business-return finding | Value | Population and period | Evidence boundary | Source |
|---|---|---|---|---|
| Video marketers saying video marketing delivered a good ROI | 82% | Routed online survey of 266 marketer and consumer respondents, late 2025 | Marketer subgroup n, geography, and financial threshold not disclosed | Wyzowl |
| Video marketers saying video directly increased sales | 83% | Video marketer respondents in the same late-2025 survey | Self-reported attribution, not a randomized or incrementality study | Wyzowl |
The one-point difference between these results is not a meaningful cross-metric gap. The questions concern different outcomes, and the public survey page does not publish the subgroup denominator or uncertainty needed to compare them statistically. Use the pair as evidence that surveyed marketers commonly reported business value, not as a forecast that another campaign will produce the same return. The video marketing analytics measurement guide addresses the separate reader job of defining events, metrics, and attribution.
03
Reported ROI by Video Format and Channel
HubSpot's format findings compare respondent judgments inside one survey, which makes the ranking useful for planning while leaving the financial definition unresolved. Marketers across B2B, B2C, nonprofit, and government organizations participated, but the public article does not disclose country weights, format subgroup sizes, or exact fieldwork dates. A selected format may have been judged on revenue, leads, efficiency, or another return concept.
48.6% of surveyed marketers selected short-form video as one of the media formats with the biggest ROI, ahead of 28.6% for long-form video and 25.1% for live streaming (HubSpot). In HubSpot's B2B subgroup, 40.5% ranked YouTube among their top three social platforms for ROI, although the subgroup size and country mix were not public (HubSpot).
Reported ROI by Video Format and Channel · Evidence chart
Open any row for its source, sample, evidence class, and limitation. Each panel uses its own declared scale.
HubSpot · formats
Short-form video named among formats with the biggest ROI48.6%
- Source
- HubSpot
- Year
- 2026
- Sample
- More than 1,500 global marketers; self-reported format ranking
- Evidence class
- Self-reported survey ranking
- Limitation
- More than 1,500 global marketers; self-reported format ranking
Long-form video named among formats with the biggest ROI28.6%
- Source
- HubSpot
- Year
- 2026
- Sample
- Same global marketer survey; format subgroup n not public
- Evidence class
- Self-reported survey ranking
- Limitation
- Same global marketer survey; format subgroup n not public
Live-streaming video named among formats with the biggest ROI25.1%
- Source
- HubSpot
- Year
- 2026
- Sample
- Same global marketer survey; no controlled format comparison
- Evidence class
- Self-reported survey ranking
- Limitation
- Same global marketer survey; no controlled format comparison
HubSpot · B2B YouTube
B2B marketers ranking YouTube among their top three social platforms for ROI40.5%
- Source
- HubSpot
- Year
- 2026
- Sample
- Global B2B subgroup; subgroup n and country mix not disclosed
- Evidence class
- Self-reported survey ranking
- Limitation
- Global B2B subgroup; subgroup n and country mix not disclosed
HubSpot's 1,500-plus global marketer survey supports comparison within the three format responses. The 40.5% YouTube result belongs to a separate B2B channel question whose subgroup size was not disclosed, so it is shown apart from the format bars (HubSpot).
| Reported format or channel return | Value | Population and interpretation | Source |
|---|---|---|---|
| Short-form video named among formats with the biggest ROI | 48.6% | More than 1,500 global marketers; self-reported format ranking | HubSpot |
| Long-form video named among formats with the biggest ROI | 28.6% | Same global marketer survey; format subgroup n not public | HubSpot |
| Live-streaming video named among formats with the biggest ROI | 25.1% | Same global marketer survey; no controlled format comparison | HubSpot |
| B2B marketers ranking YouTube among their top three social platforms for ROI | 40.5% | Global B2B subgroup; subgroup n and country mix not disclosed | HubSpot |
The ranking does not establish that shortening a video will raise return or that YouTube will outperform another channel for a specific company. Format, audience, offer, creative quality, placement, and cost all vary together in real campaigns.
04
B2B Content Results Compared
Content Marketing Institute and MarketingProfs asked a different question from HubSpot. Their annual study asked which content types produced the best results during the prior year. The article reports a B2B respondent subset, mostly in North America, and preserves the full sample and fieldwork dates in the table below.
58% of B2B content marketers said video produced the best results, compared with 53% for case studies or customer stories, 45% for ebooks or white papers, 45% for research reports, and 43% for short articles or posts (Content Marketing Institute and MarketingProfs). “Best results” was respondent-defined, so the ranking can support a comparison of perceived content performance but not a claim about audited profit.
| B2B content type reported to produce the best results | Value | Population and period | Source |
|---|---|---|---|
| Video | 58% | 980 B2B respondents, mostly North America; prior 12 months | CMI and MarketingProfs |
| Case studies or customer stories | 53% | Same survey, fielded June 25 to August 16, 2024 | CMI and MarketingProfs |
| Ebooks or white papers | 45% | Same survey and respondent-defined outcome | CMI and MarketingProfs |
| Research reports | 45% | Same survey and respondent-defined outcome | CMI and MarketingProfs |
| Short articles or posts | 43% | Same survey and respondent-defined outcome | CMI and MarketingProfs |
The five-point gap between video and case studies is descriptive, not proof that video caused stronger results. The study does not publish a common financial formula for “best results,” and respondents may have used different objectives. The safest reading is that video led this B2B content-format perception ranking while several text-led formats remained close comparators. For a narrower review of experimental and adjacent causal evidence, use the explainer conversion benchmark audit; it does not turn this perception ranking into a conversion claim.
05
Video Investment Signals Are Not Realized Return
Investment plans show where marketers expect value and where production capacity may need to grow. They do not show that the planned spending earned a return. The HubSpot planning question and Nielsen channel-spending question cover different samples and periods, so the percentages should not be combined into a trend line.
37.1% of more than 1,500 surveyed global marketers planned to increase video-marketing investment in 2026 (HubSpot). 65% of nearly 2,000 global marketers managing at least $1 million planned to increase online or mobile video spending in 2024 (Nielsen annual report, PDF page 7). The Nielsen sample excludes marketers managing smaller budgets, and both figures record intentions rather than realized sales or profit.
| Video investment signal | Value | Population and period | Evidence boundary | Source |
|---|---|---|---|---|
| Marketers planning to increase video-marketing investment | 37.1% | More than 1,500 global marketers; 2026 plans | Country weights and exact fieldwork dates not public | HubSpot |
| Marketers planning to increase online or mobile video spending | 65% | Nearly 2,000 global marketers managing at least $1 million; surveyed December 2023 | Budget intention, not observed ROI | Nielsen annual report, PDF page 7 |
Investment interpretation needs a cost denominator. Media spend, production, revisions, distribution, and internal labor can all change the return calculation, so a budget increase is not evidence that the previous budget was optimal. This explainer video cost guide lists production inputs that can be included before a team compares return across formats.
For small brands and SaaS teams producing product explanations, TapVid is an Explainer Video Engine built around accuracy. Product assets enter without being redrawn, supplied wording and numbers stay literal, and users can inspect script, scene, voiceover, and asset correspondence before rendering. Those controls make campaign inputs and versions easier to audit; they do not demonstrate that TapVid raises ROI, sales, or ROAS, or that it lowers cost. Teams can inspect the animated explainer video maker and evaluate its output against their own predeclared business outcome and full cost baseline.
06
Modeled ROAS and Long-Term Sales
The Nielsen/TikTok findings are closer to business return because the study used tailored marketing mix models tied to sales. They are also narrow. TikTok commissioned the analysis, and Nielsen modeled a small group of Food & Beverage and Health & Personal Care brands in Indonesia and Thailand using multiple years of sales, media, and non-marketing inputs. The public case study does not disclose the exact campaign count, spend distribution, confidence intervals, or brand-level range.
TikTok paid ads generated a modeled $2.30 in combined short-term and long-term sales per advertising dollar across the 10 CPG brands (Nielsen and TikTok). The same models reported 2.2 times as much long-term brand-equity-driven sales as other measured media, with Facebook and Google excluded from that comparator basket (Nielsen and TikTok). They also associated at least four weeks of concurrent TikTok and television advertising with 9.4% incremental sales (Nielsen and TikTok).
| Modeled return finding | Value | Population and design | Source |
|---|---|---|---|
| Total short-term and long-term sales return per TikTok ad dollar | $2.30 | Nielsen MMM of 10 CPG brands in Indonesia and Thailand, modeled in 2023 | Nielsen and TikTok |
| Long-term brand-equity-driven sales relative to other measured media | 2.2 times | Same commissioned models; comparator excluded Facebook and Google | Nielsen and TikTok |
| Incremental sales associated with running TikTok and television together for at least four weeks | 9.4% | Same 10-brand models with media and non-marketing controls | Nielsen and TikTok |
These values should not be presented as a platform-wide guarantee. They support two narrower interpretations: a short attribution window may omit modeled long-term sales, and cross-channel interaction can matter in an MMM. Applying either insight elsewhere requires a new model with that advertiser's markets, costs, sales history, and campaign mix.
07
Sales Lift, Purchase Intent, and Advertiser ROI
The final pair of studies uses different outcomes. Kantar compared purchase-intent effects across advertising tests, while Ebiquity and Google modeled a single advertiser's YouTube ROI. Neither result can be merged with the TikTok ROAS estimate or the Wyzowl self-reported sales finding.
Kantar found YouTube advertising was 4.3 times as effective at driving purchase intent as social advertising across 415 YouTube tests and 466 social tests in Europe, the Middle East, and Africa in November 2024 (Google and Kantar). Purchase intent is an intermediate survey or test outcome, not realized sales or profit.
Domino's U.K. and Ireland measured a 45% increase in YouTube ROI when brand-awareness and performance campaigns ran concurrently, based on one year of campaign data analyzed through media mix modeling (Domino's, Ebiquity, and Google). The case supports a cross-funnel investment interpretation for that advertiser, but it does not disclose a universal lift available to other brands.
| Tested or advertiser-specific finding | Value | Population and design | Source |
|---|---|---|---|
| YouTube effectiveness at driving purchase intent relative to social advertising | 4.3 times | Kantar meta-analysis of 415 YouTube tests and 466 social tests across EMEA, November 2024 | Google and Kantar |
| Increase in YouTube ROI when brand and performance campaigns ran together | 45% | One year of Domino's U.K. and Ireland campaign data, analyzed in 2024 | Domino's, Ebiquity, and Google |
For an explainer or product-video test, the same labeling discipline applies. A click, lead, purchase-intent response, reported sale, modeled incremental sale, and profit-based ROI each answer a different business question. The business-return claim still needs its own denominator and evidence design.
08
Methodology and Limitations
This roundup retains direct original research pages and excludes metric-selection, instrumentation, generic platform telemetry, and distribution benchmarks that belong to a separate analytics reader task. Every retained statistic is stored as an atomic dataset record with publication date separated from fieldwork or model period. No value was added to preserve a target count, and no cross-study average was calculated.
The evidence classes are not interchangeable:
The ladder ranks what each evidence class can support, not the magnitude of unlike outcomes. Wyzowl records marketer perceptions, Nielsen/TikTok reports modeled sales, Google/Kantar measures purchase intent, and Domino's reports one advertiser program (Wyzowl; Nielsen and TikTok; Google and Kantar; Domino's).
| Evidence class | Retained records | What it can support | Main limitation |
|---|---|---|---|
| Routed marketer survey | Wyzowl good-ROI and direct-sales findings | How surveyed video marketers described return and sales | Subgroup n, geography, financial definition, and causal design not public (Wyzowl) |
| Global marketer survey | HubSpot ROI rankings and investment intent | Reported format or channel return and 2026 budget plans | Country weights, subgroup n, and exact fieldwork dates not public (HubSpot) |
| B2B content survey | CMI and MarketingProfs format-result ranking | Which content types respondents said produced the best results | Mostly North American sample and respondent-defined outcome (CMI and MarketingProfs) |
| Large-budget global marketer survey | Nielsen online/mobile video spending intent | Planned channel investment among marketers managing at least $1 million | Excludes smaller budgets and does not measure realized return (Nielsen annual report) |
| Marketing mix modeling | Nielsen/TikTok and Domino's cases | Modeled ROAS, sales interaction, and advertiser-specific ROI | Commissioning, regional or single-brand scope, and incomplete public uncertainty details (Nielsen and TikTok; Domino's) |
| Test meta-analysis | Google and Kantar purchase-intent comparison | Relative purchase-intent effect across a large EMEA test base | Platform commissioning and an intermediate outcome rather than sales or profit (Google and Kantar) |
All 18 retained records are reported values from their source pages rather than calculations produced for this article. Several sources omit exact fieldwork dates, subgroup sizes, country weights, or confidence intervals; those gaps remain explicit instead of being inferred. The largest sources each provide five records, so HubSpot and CMI/MarketingProfs each account for 27.8% of the 18-statistic dataset (HubSpot; CMI and MarketingProfs). That exceeds the normal 20% diversity preference, but the concentration is disclosed rather than diluted with weaker, off-intent, or duplicate evidence.
09
Video Marketing ROI by the Numbers
The table below lists every retained finding. Read the outcome label, population, geography, and design before applying any value to an investment decision.
| Metric | Value | Source |
|---|---|---|
| Surveyed video marketers reporting a good ROI | 82% | Wyzowl |
| Surveyed video marketers saying video directly increased sales | 83% | Wyzowl |
| Global marketers selecting short-form video among formats with the biggest ROI | 48.6% | HubSpot |
| Global marketers selecting long-form video among formats with the biggest ROI | 28.6% | HubSpot |
| Global marketers selecting live-streaming video among formats with the biggest ROI | 25.1% | HubSpot |
| B2B marketers ranking YouTube among their top three social platforms for ROI | 40.5% | HubSpot |
| Global marketers planning to increase video-marketing investment | 37.1% | HubSpot |
| B2B content marketers saying video produced the best results | 58% | CMI and MarketingProfs |
| B2B content marketers saying case studies or customer stories produced the best results | 53% | CMI and MarketingProfs |
| B2B content marketers saying ebooks or white papers produced the best results | 45% | CMI and MarketingProfs |
| B2B content marketers saying research reports produced the best results | 45% | CMI and MarketingProfs |
| B2B content marketers saying short articles or posts produced the best results | 43% | CMI and MarketingProfs |
| Global marketers planning more online or mobile video spending | 65% | Nielsen annual report, PDF page 7 |
| TikTok modeled total short-term and long-term sales return per advertising dollar | $2.30 | Nielsen and TikTok |
| TikTok modeled long-term brand-equity-driven sales relative to other measured media | 2.2 times | Nielsen and TikTok |
| Incremental sales associated with at least four weeks of combined TikTok and television advertising | 9.4% | Nielsen and TikTok |
| YouTube effectiveness at driving purchase intent versus social advertising in EMEA | 4.3 times | Google and Kantar |
| Domino's increase in YouTube ROI from concurrent brand and performance campaigns | 45% | Domino's, Ebiquity, and Google |
10
Sources
- Wyzowl, Video Marketing Statistics 2026
- HubSpot, 2026 State of Marketing
- Content Marketing Institute and MarketingProfs, B2B Content Marketing Outlook for 2025
- Nielsen, 2024 Annual Marketing Report (PDF)
- Nielsen and TikTok, Southeast Asia CPG Marketing Mix Modeling Meta Analysis
- Google and Kantar, YouTube Social Advertising Study
- Domino's, Ebiquity, and Google, YouTube Media Mix Modeling Case