
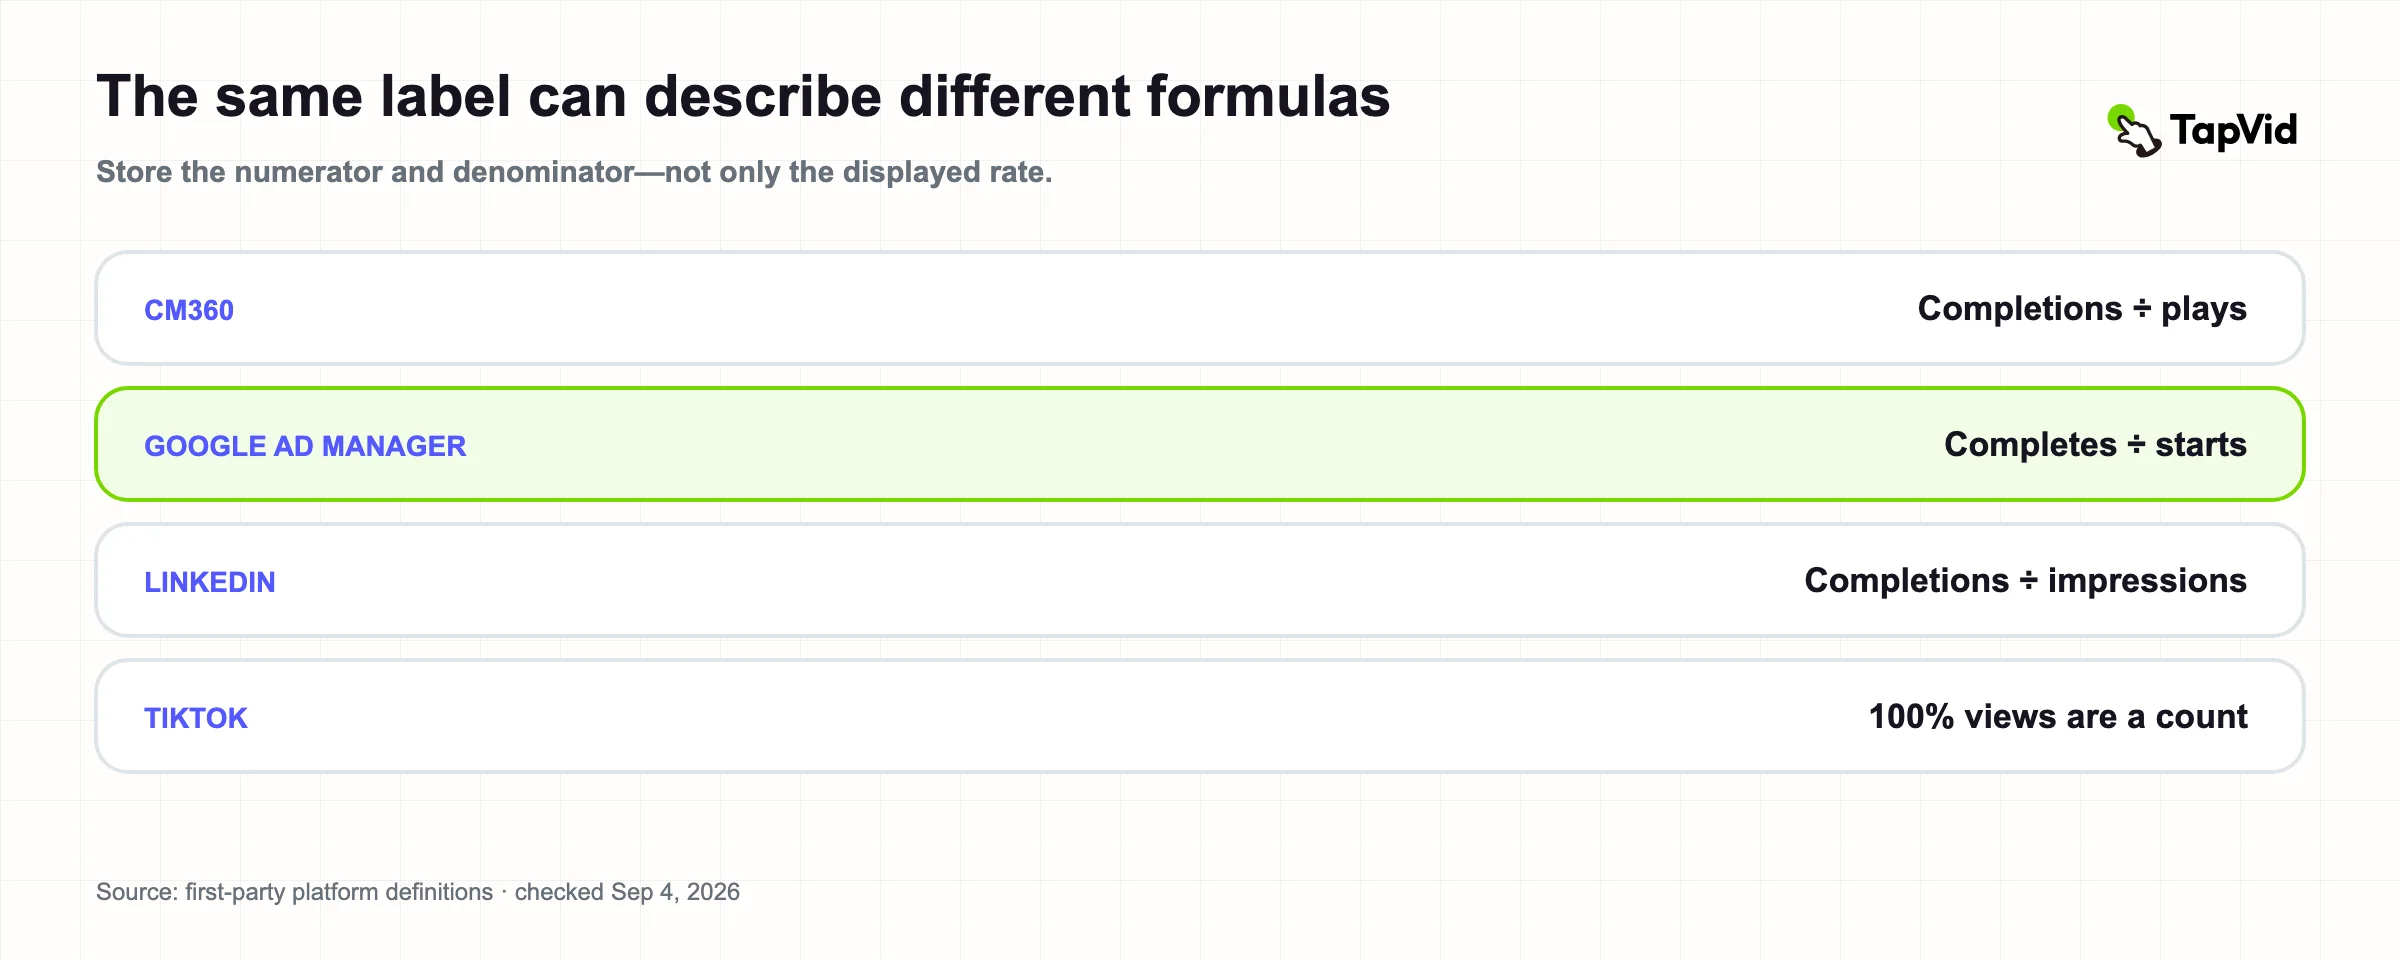
Video completion rate looks like a simple formula: completions divided by views. In current platform documentation, the denominator may instead be plays, starts, impressions, or viewers. Some products report a 100% milestone count rather than a rate. Others show average percentage viewed, which is not completion at all. We audited seven first-party definitions and benchmark contexts across Campaign Manager 360, Google Ad Manager, LinkedIn Campaign Manager, TikTok Ads Manager, YouTube Analytics, Wistia, and Vidyard. Google Campaign Manager 360 divides completions by video plays. Google Ad Manager divides completes by starts. LinkedIn divides completions by impressions after a March 2025 methodology change that was applied to historical data. Those rates cannot be copied into one benchmark table without preserving the denominator. The headline lesson is not that one platform is wrong. Each metric serves a different reporting system. The error happens when an analyst exports the labels, drops the formulas, and compares unlike numbers.
01
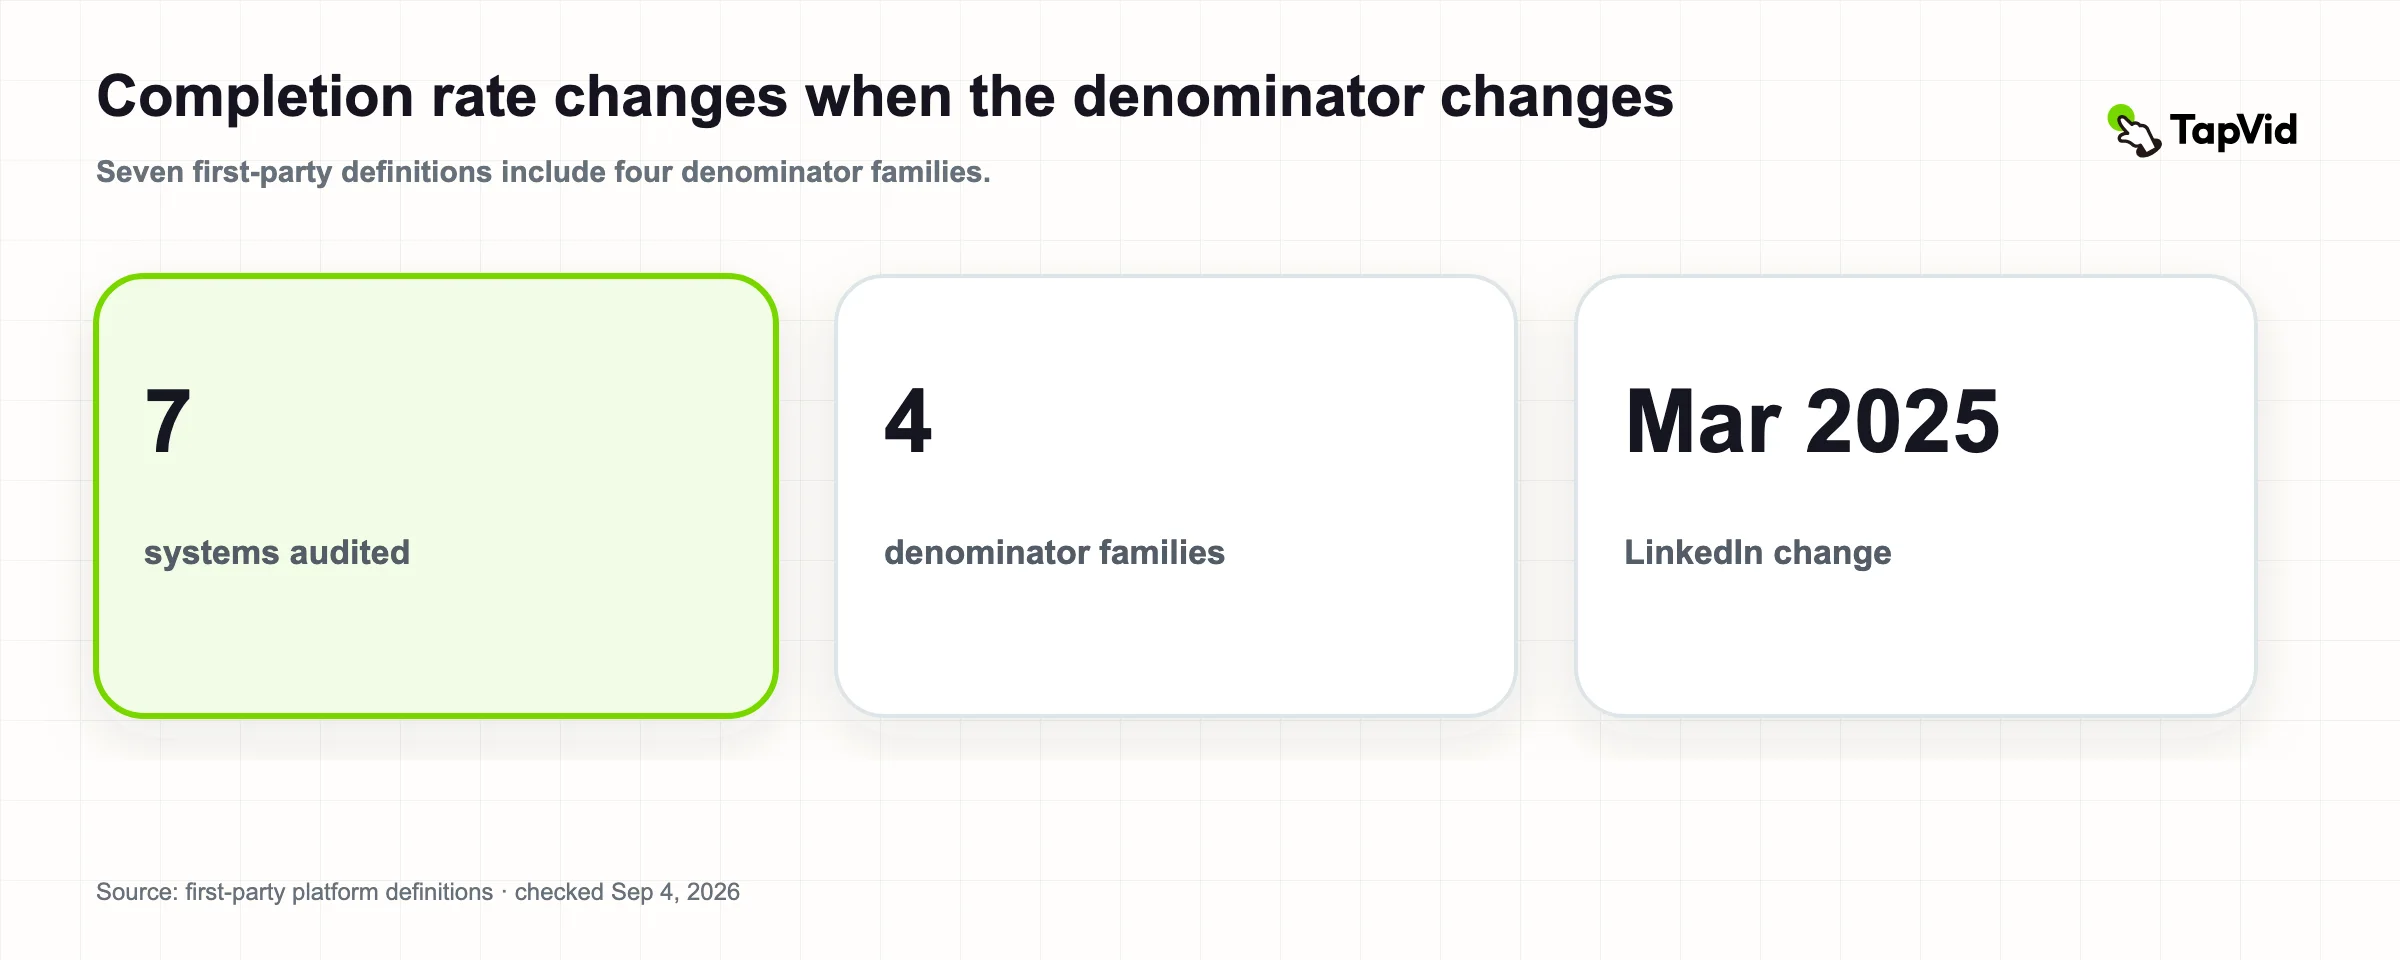
Video completion rate definitions at a glance
Video completion rate definitions at a glance
7
systems and benchmark contexts audited
The same topic is represented by rates, milestone counts, average watch share, and end retention.
Campaign Manager 360Checked 2026-09-04
4
denominator families
Plays, starts, impressions, and viewers appear in the audited definitions.
Campaign Manager 360Checked 2026-09-04
Mar 2025
LinkedIn methodology change
Completion rate changed to completions divided by impressions and was applied to historical data.
Campaign Manager 360Checked 2026-09-04
| Value | Finding | Why it matters |
|---|---|---|
| 7 | systems and benchmark contexts audited | The same topic is represented by rates, milestone counts, average watch share, and end retention. |
| 4 | denominator families | Plays, starts, impressions, and viewers appear in the audited definitions. |
| Mar 2025 | LinkedIn methodology change | Completion rate changed to completions divided by impressions and was applied to historical data. |
Download the video completion rate definition dataset. Each row preserves the published definition, denominator, replay treatment where disclosed, scope or methodology change, official source, and verification date.
Sources: Campaign Manager 360, Google Ad Manager, LinkedIn Campaign Manager, TikTok Ads Manager, and YouTube Analytics, checked September 4, 2026.
Verification date:
- 2026-09-04
02
Seven definitions compared
| System | Metric | Published or operational definition | Denominator |
|---|---|---|---|
| Campaign Manager 360 | Video completion rate | Completions ÷ plays × 100 | Video plays |
| Google Ad Manager | Completion rate | Completes ÷ starts | Video starts |
| LinkedIn Campaign Manager | Completion Rate | Completions ÷ impressions × 100 | Video impressions |
| TikTok Ads Manager | Video views at 100% | Count of impressions whose video played 100%; replays excluded | Count, not a published rate |
| YouTube Analytics | Average percentage viewed | Average share watched among those who stayed to watch | Engaged viewers / views |
| Wistia | Average engagement | Time played ÷ (plays × media length) | Available played time |
| Vidyard | Viewers retained to end | Share of viewers staying engaged to the end | Viewers |
The last three rows are included because they are frequently mislabeled as completion rate in secondary articles and dashboards. YouTube's average percentage viewed and Wistia's average engagement can be high when no individual viewer completes. TikTok's 100% view metric is a numerator until an analyst chooses a denominator. Vidyard's published benchmark uses end-retention wording but does not share the same formula as the Google ad systems.
03
Campaign Manager 360 uses video plays
Google's Campaign Manager 360 benchmark defines video completion rate as:
Video completions ÷ video plays × 100
The page describes an industry benchmark using the last 90 days. This play-based denominator asks: among the times playback began under the system's play definition, how many reached completion?
If 1,000 plays produce 420 completions, the Campaign Manager-style VCR is 42%. Do not compare that number directly with an impression-based rate unless starts and impressions are identical—which they rarely are.
04
Google Ad Manager uses video starts
Source: TapVid public research dataset; verified 2026-09-04.
Google Ad Manager's interactive-report metric lists completion rate as video completes divided by video starts. This is conceptually close to a play-based rate, but event definitions can still differ. One system may count autoplay as a play, require a minimum visible state, or deduplicate replays differently.
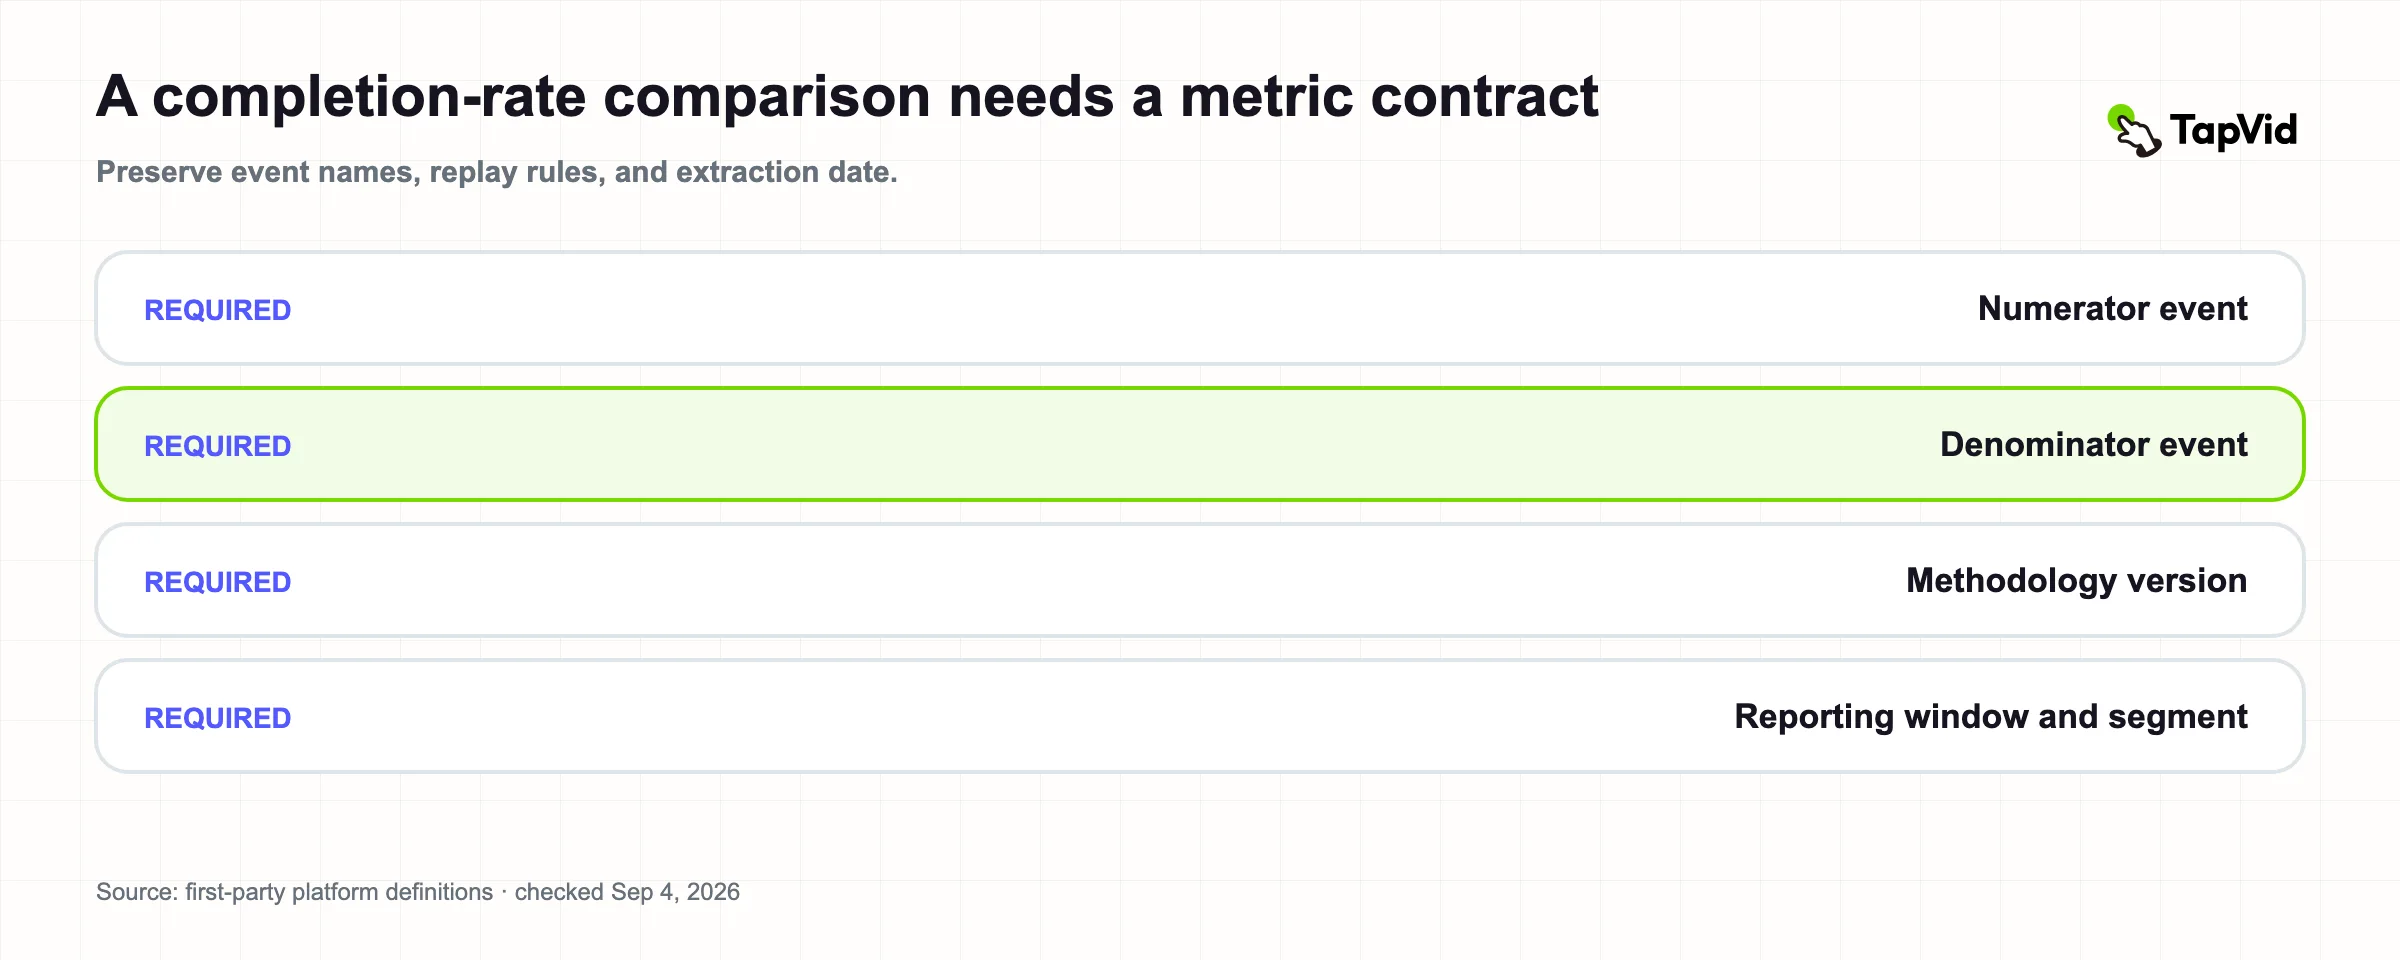
The safe data-model choice is to retain the raw numerator and denominator event names. Store `video_completes`, `video_starts`, and the derived rate rather than importing only a column called `completion_rate`.
05
LinkedIn uses impressions—and changed history
LinkedIn Campaign Manager currently defines Completion Rate as completions divided by video impressions. Its help page says the calculation changed in March 2025 from completions divided by plays to completions divided by impressions. LinkedIn applied the current definition to historical data as well.
This creates two analytics risks.
First, a LinkedIn completion rate will usually be lower than a start-based rate when many impressions never begin meaningful playback. Second, a previously exported report can disagree with a newly exported historical report even though the campaign events did not change. The formula changed.
Record the extraction date and metric-definition version beside any LinkedIn benchmark. A year-over-year chart without that metadata may show a methodology break as creative performance.
LinkedIn also defines a completion as a video ad that played through 97–100% of its length, including watches that skipped to that point. “Completion” therefore does not always mean continuous viewing of every prior second.
06
TikTok publishes a 100% view count
TikTok defines Video views at 100% as the number of times a video was played through 100% of its length. Plays are counted separately for each ad impression, and replays are excluded. The same documentation defines 25%, 50%, and 75% milestone counts.
The official page describes counts, not one universal “completion rate” formula. An analyst could divide 100% views by impressions, initial video plays, two-second views, or another event. Each result answers a different question.
If a dashboard derives TikTok VCR, name the denominator in the metric label—for example, `100% views / impressions`—and keep the original fields available. Never import a derived rate as though TikTok published that exact formula.
07
YouTube average percentage viewed is not completion rate
YouTube Analytics defines average percentage viewed as the average percentage of a video watched among people who stayed to watch. For Shorts, the metric is calculated from engaged views and their corresponding watch time, and loops are excluded from engaged views.
A 60% average percentage viewed does not mean 60% of viewers completed. Ten viewers could each watch the first 60%, or some could finish while others leave early. The metric describes average consumption depth, not the distribution of completions.
Use YouTube audience-retention and milestone information when the question is where viewers leave. Use average percentage viewed to compare consumption depth among similar formats. Do not relabel it VCR.
08
Wistia average engagement is also a different metric
Source: TapVid public research dataset; verified 2026-09-04.
Wistia calculates average engagement as total time played ÷ (total plays × media length). Its published benchmark sheet reports 50% for videos below one minute and progressively lower averages for longer buckets.
That statistic is useful for understanding how much of a hosted video was consumed. It is not the fraction of viewers reaching the final frame. Rewatches and partial viewing can influence time played even when completion count is unchanged.
The companion video engagement benchmark study keeps Wistia and Vidyard figures separate and shows why label normalization should happen before analysis.
09
Published completion benchmarks need their source context
Vidyard's 2025 Video in Business Benchmark says 65% of viewers stay engaged to the end for videos under one minute and 20% for videos over 20 minutes. The underlying report covers anonymized customer data and 943,305 videos created in 2024.
These figures are useful within a business-video and sales-video context. They are not a substitute for an ad-platform VCR because the population, placement, viewer intent, and denominator differ. A prospect who clicks a one-to-one sales video starts with more intent than an impression served in a feed.
When quoting a completion benchmark, preserve five fields:
1. platform and product; 2. metric formula; 3. length bucket; 4. sample and observation period; 5. traffic and placement context.
If any field is unavailable, say so rather than filling it from another report.
10
Build a completion-rate metric contract
Use a data dictionary that makes comparison explicit:
| Field | Example |
|---|---|
| Metric ID | `linkedin_completion_per_impression_v2025_03` |
| Numerator | Video completions at 97–100% |
| Denominator | Video impressions |
| Unit | Ad impression |
| Replay rule | Follow platform definition; preserve source note |
| Autoplay rule | Platform-defined; document if known |
| Observation window | Campaign date range and extraction date |
| Version | Definition effective March 2025 |
For internal comparisons, calculate a common metric only when the raw events are semantically compatible. If every platform provides impressions and 100% milestone counts under acceptable definitions, an impression-based rate can be built. Label it as an internal normalized metric and keep platform-native rates beside it.
11
How to use VCR without optimizing for the wrong thing
Completion is most useful when the final seconds contain necessary information. If the CTA, price, or legal qualifier appears only at the end, low completion means many viewers never saw it. The first fix may be information order, not a shorter animation.
For product and explainer video, pair VCR with:
- average watch time or percentage viewed;
- first-quarter drop-off;
- clicks or conversion assists;
- approved product-claim exposure;
- the actual downstream task, such as signup, demo request, or completed setup.
Keep the source copy and product assets stable when testing pacing. TapVid makes approved assets, script, and scene mapping visible before output and allows a specific scene to be revised while preserving the rest. That helps teams create controlled variants, but the product does not guarantee a completion rate. Performance must be measured with the actual audience and placement.
12
Methodology
Source: TapVid public research dataset; verified 2026-09-04.
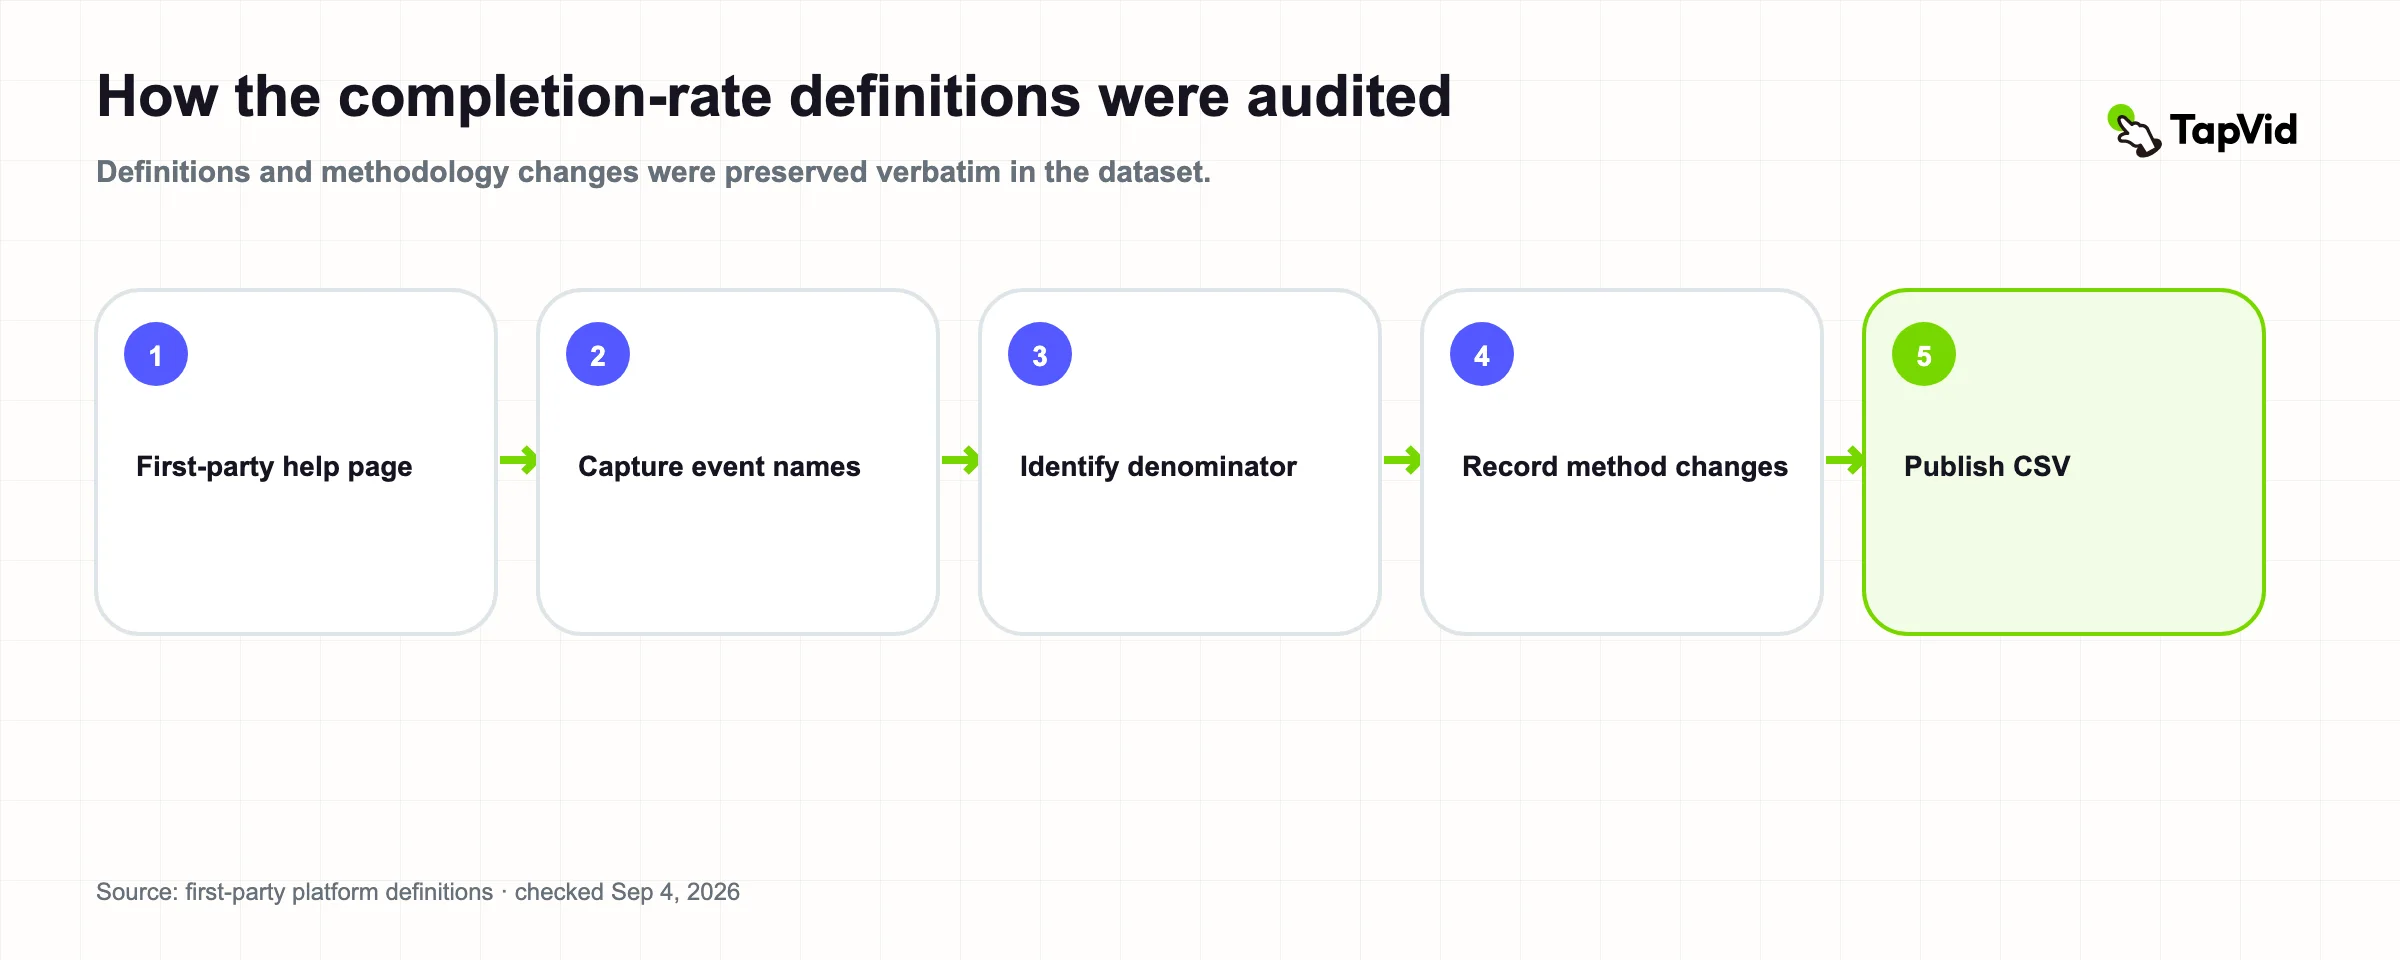
We selected first-party platform or product documentation that defines a completion-related metric or a commonly confused watch-depth metric. One row represents one reporting system and its current public definition. We transcribed the numerator, denominator, replay rule, methodology change, and scope when stated.
We did not force the systems into one formula. TikTok's 100% milestone remains a count. YouTube average percentage viewed and Wistia average engagement are marked as non-completion measures. Vidyard's public end-retention benchmark is retained with its own wording. All pages were checked September 4, 2026. Dataset version: 1.0.
13
Limitations
This is a documentation audit, not an independent event-level validation. Platform implementations may contain conditions not fully described on public pages. Definitions can change, and some pages apply changes to historical data. Organic video, paid video, hosted business video, and one-to-one sales video have different populations. The dataset does not provide a universal benchmark or prove that any length causes higher completion.
Before using the table in reporting, verify the current source, export the raw numerator and denominator, and save the extraction date.
14
References and citation
Cite this research
Recommended citation (APA)
Chen, K. (2026, September 4). Video completion rate 2026: Seven definitions audited (Version 1.0). TapVid Research. https://tapvid.ai/blog/video-completion-rate
BibTeX
@techreport{chen2026videoCompletionRate,
  author = {Kenneth Chen},
  title = {Video Completion Rate 2026: Seven Definitions Audited},
  institution = {TapVid Research},
  year = {2026},
  month = {September},
  url = {https://tapvid.ai/blog/video-completion-rate},
  note = {Version 1.0}
}
Data and source register
- TapVid video completion rate definition dataset (CSV)Checked 2026-09-04
Version 1.0
15
Frequently asked questions
What is video completion rate?
It is the percentage of a stated denominator that reached a platform-defined completion event. The denominator may be plays, starts, impressions, or viewers. Always read the platform formula before comparing rates.
What is a good video completion rate?
There is no universal number. Use a benchmark from the same product, denominator, length, placement, audience, and reporting period. Vidyard reports 65% end retention below one minute and 20% above 20 minutes for its 2024 business-video data, but those figures are not directly comparable with impression-based ad VCR.
Is average percentage viewed the same as completion rate?
No. Average percentage viewed measures average consumption depth. It does not show the share of viewers or impressions that reached the end.
Why did my historical LinkedIn completion rate change?
LinkedIn says it changed the calculation in March 2025 from completions divided by plays to completions divided by impressions and applied the current definition to historical data. Save the extraction date and definition version with your report.