검증된 숫자 붙여 넣기
확인한 값을 붙여 넣고 보여 줄 비교나 추세를 설명하세요.
검증된 숫자를 설명 영상용 애니메이션 차트로 바꾸세요. 모션 디자인 타임라인 없이 바 차트 레이스, 라인 리빌, KPI 카운터를 만들 수 있습니다.
데이터에서 생성된 실제 결과물, 수작업 애니메이션 없이.
확인한 값을 붙여 넣고 보여 줄 비교나 추세를 설명하세요.
TapVid가 차트 유형을 골라 애니메이션합니다. 막대가 자라나고, 선이 그려지고, 카운터가 올라갑니다.
색상, 단위, 라벨, 속도를 프롬프트로 바꾼 뒤 MP4로 내보내세요.
애니메이션 차트 메이커는 검증된 숫자를 움직이는 차트로 바꿔줍니다. 정적인 이미지 대신 자라나는 막대, 그려지는 선, 올라가는 카운터가 담긴 데이터 시각화 영상을 얻게 됩니다. 숫자를 붙여 넣고 전달할 내용을 설명하면 보통 After Effects나 모션 디자이너가 필요한 애니메이션을 TapVid가 구성합니다.
숫자는 움직일 때 더 직관적으로 와닿습니다. 분기 대비 상승은 표의 한 행보다 움직이는 막대로 볼 때 훨씬 강하게 전달되고, 순위는 정적인 목록보다 바 차트 레이스로 보여줄 때 더 명확합니다. 문제는 늘 제작이었습니다. 차트를 손으로 애니메이션하는 일은 느리고 기술적이라, 대부분의 팀은 스프레드시트를 캡처하고 넘어갑니다. TapVid는 모션을 대신 생성하면서 데이터는 계속 편집 가능하게 유지합니다.
모든 차트가 여러분의 데이터로 만들어지기 때문에, 결과물은 템플릿이 아니라 여러분의 리포트와 딱 맞아떨어집니다. 차트 유형, 색상, 속도를 직접 선택할 수 있고, 값이나 라벨을 프롬프트로 바꿔 다시 렌더링할 수 있어서 막판 데이터 수정이 있어도 영상을 처음부터 다시 만들 필요가 없습니다.
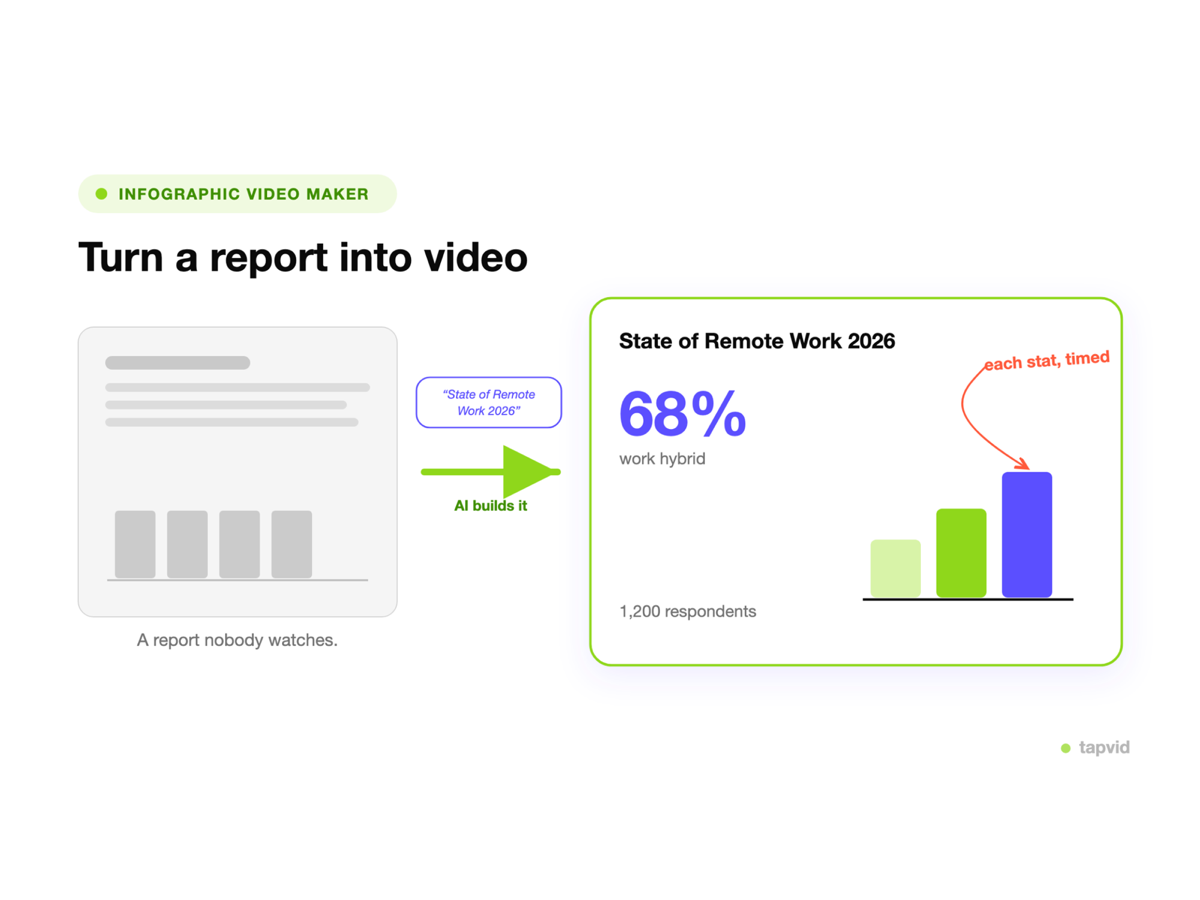
이미 확인한 값을 붙여 넣고 시청자가 이해해야 할 비교나 추세를 설명하세요. 빈 모션 디자인 타임라인이 아니라 승인된 데이터에서 시작합니다.
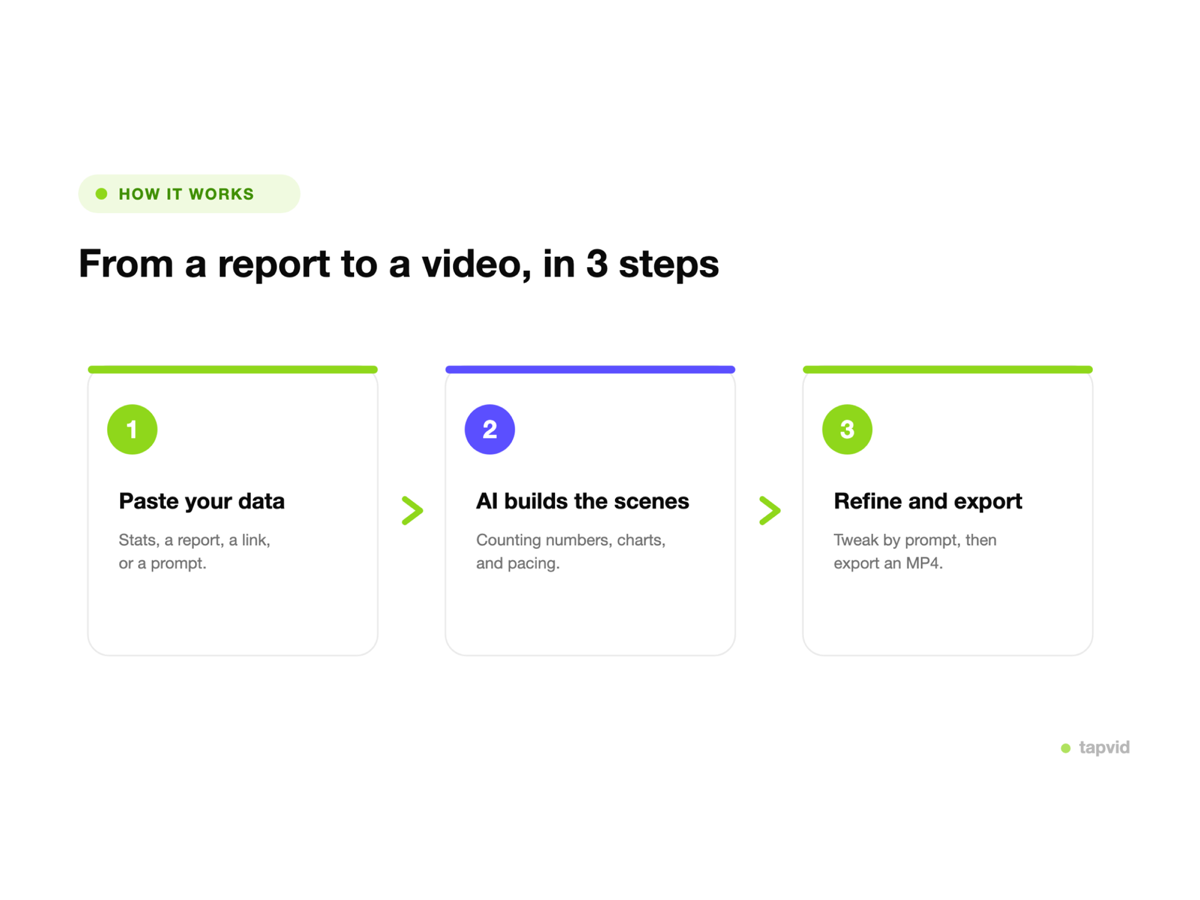
바 레이스, 라인 리빌, KPI 카운터, 또는 파이·도넛을 고르면 TapVid가 애니메이션을 만듭니다. 막대가 자라나고, 선이 그려지고, 숫자가 올라가며, 밋밋한 슬라이드가 아니라 데이터 스토리처럼 속도가 맞춰집니다.
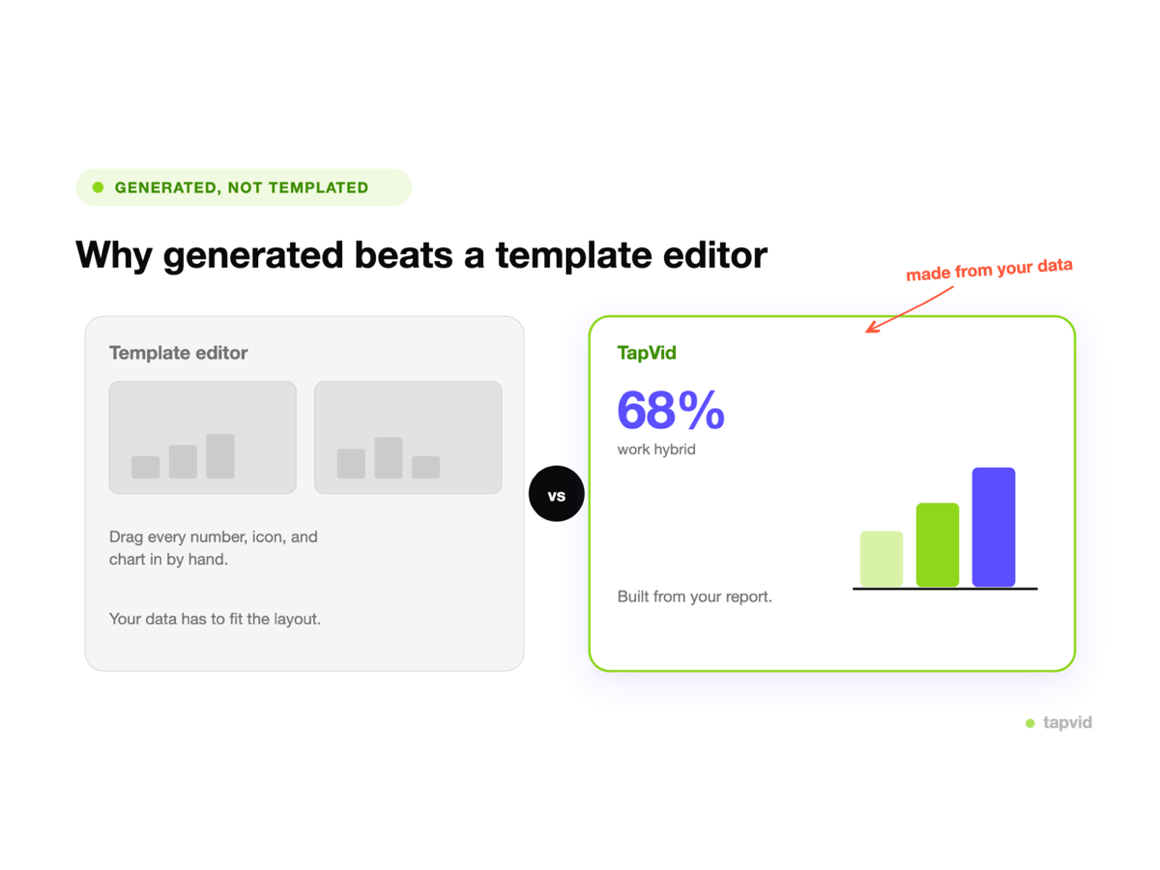
색상, 단위, 라벨, 속도를 설명하는 것만으로 바꾼 뒤, MP4로 내보내 덱, 릴, 리포트에 넣으세요. 숫자를 고치고 몇 초 만에 다시 렌더링하세요.
검증된 숫자와 명확한 차트 요구사항을 주면 애니메이션이 만들어집니다. After Effects도, 데이터 시각화 라이브러리도, 키프레임 작업도 필요 없습니다.
값, 라벨, 단위를 설명하는 것만으로 바꾸고 다시 렌더링하세요. 데이터 수정이 전체 재작업이 아니라 몇 초로 끝납니다.
바 레이스, 라인 리빌, KPI 카운터, 파이·도넛 차트를 자동으로 선택하거나 스타일 행에서 직접 고르세요.
웹 페이지에만 사는 임베드가 아니라, 덱, 릴, 리포트에서 재생되는 MP4로 내보내세요.
프롬프트로 색상, 단위, 타이밍을 조정해 여러 차트에서 일관된 룩을 유지하세요.
전에는 전문가가 몇 시간씩 걸렸던 차트를, 하루 오후면 완성할 수 있습니다.
하나의 생성기가 단일 애니메이션 KPI부터 완성형 바 차트 레이스까지, 팀이 가장 많이 찾는 데이터 영상을 모두 담아냅니다.
매출, 성장률, 마진 수치를 움직이는 막대와 카운터로 바꿔 이사회 덱이나 투자자 업데이트에 활용하세요.
시장 규모, 비교, 추세를 움직이게 만들어, 빽빽한 표 대신 몇 초 만에 읽히는 리서치 포인트를 전달하세요.
화면에서 애니메이션되는 통계로 게시물이나 릴을 시작하세요. 스크롤을 멈추게 하는 바로 그 후크입니다.
시장 점유율부터 팔로워 수까지 시간에 따른 무엇이든, 스스로 펼쳐지는 바 차트 레이스로 순위를 매기세요.
중요한 지표를 카운터와 리빌로 바꿔 전사 회의 리캡이나 주간 업데이트에 활용하세요.
설문의 비율과 세부 항목을 파이, 도넛, 바 차트로 애니메이션해 사람들이 실제로 보게 만드세요.
정적 도구는 웹 페이지에 차트를 임베드하고, 화면 녹화기는 이미 화면에 있는 것을 그대로 담을 뿐입니다. TapVid는 여러분의 데이터로 애니메이션 차트를 편집 가능한 영상으로 생성하므로, 숫자를 고치고 몇 초 만에 다시 렌더링할 수 있습니다.
| 정적 차트 도구 (Flourish) | 화면 녹화 (CapCut) | TapVid | |
|---|---|---|---|
| 결과물 | 웹 임베드 | 화면 녹화 | 편집 가능한 MP4 |
| 애니메이션 | 정적 이미지 | 녹화한 것만 | 대신 생성 |
| 데이터 변경 | 다시 임베드 | 다시 녹화 | 프롬프트로 재렌더링 |
| 색상 및 라벨 스타일 변경 | 수동 | 불가 | 프롬프트로 |
| 필요한 기술 | 차트 설정 | 영상 편집 | 없음 |
| 덱이나 릴에 사용 | 캡처해서 | 가능 | MP4로 가능 |
이사회 덱과 투자자 업데이트를 위한 애니메이션 실적, KPI, 분기 업데이트 차트.
시장 데이터, 추세, 비교를 발견이 한눈에 보이는 데이터 영상으로 바꾸세요.
스크롤을 멈추고 공유를 부르는 통계 후크, 바 차트 레이스, 설문 결과.
3 크레딧 = 1초. 실제로 렌더링된 만큼만 지불합니다. 무료로 시작하고 언제든 업그레이드하세요.
$49/mo
2,000 크레딧 / 월
$99/mo
6,000 크레딧 / 월
$199/mo
14,000 크레딧 / 월
AI로 몇 분 만에 전문 영상을 만드는 수천 개 제품 팀에 합류하세요.